1824 United States presidential election in Kentucky
| ||||||||||||||||||||||||||
| ||||||||||||||||||||||||||
| ||||||||||||||||||||||||||
| Elections in Kentucky |
|---|
 |
|
|
The 1824 United States presidential election in Kentucky took place between October 26 and December 2, 1824, as part of the 1824 United States presidential election. Voters chose 14 representatives, or electors to the Electoral College, who voted for President and Vice President.
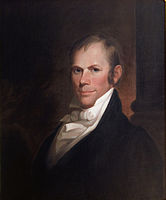
During this election, the Democratic-Republican Party was the only major national party, and four different candidates from this party sought the presidency. Kentucky voted for Henry Clay over Andrew Jackson, John Quincy Adams, and William H. Crawford. Clay won Kentucky, his home state, by a wide margin of 43.46%.[1]
Kentucky was divided into three electoral districts for this election, with electors chosen through block voting. District 1 elected four electors, while Districts 2 and 3 elected five electors each.[1]
Results
[edit]| 1824 United States presidential election in Kentucky | |||||
|---|---|---|---|---|---|
| Party | Candidate | Votes | Percentage | Electoral votes | |
| Democratic-Republican | Henry Clay | 17,207 | 71.73% | 14 | |
| Democratic-Republican | Andrew Jackson | 6,658 | 27.76% | 0 | |
| Democratic-Republican | John Quincy Adams | 120 | 0.50% | 0 | |
| Democratic-Republican | William H. Crawford | 3 | 0.01% | 0 | |
| Totals | 23,988 | 100.0% | 14 | ||
Results by electoral district
[edit]| District | Henry Clay
Democratic-Republican |
Andrew Jackson
Democratic-Republican |
John Quincy Adams
Democratic-Republican |
William H. Crawford
Democratic-Republican |
Margin | Total Votes Cast | |||||||||
|---|---|---|---|---|---|---|---|---|---|---|---|---|---|---|---|
| # | % | Electors | # | % | Electors | # | % | Electors | # | % | Electors | # | % | ||
| 1 | 3,861 | 71.47% | 4 | 1,473 | 27.27% | 0 | 65 | 1.20% | 0 | 3 | 0.06% | 0 | 2,320 | 42.94% | 5,402 |
| 2 | 6,165 | 69.46% | 5 | 2,711 | 30.54% | 0 | no candidates | no ballots | 3,454 | 38.92% | 8,876 | ||||
| 3 | 7,181 | 73.95% | 5 | 2,474 | 25.48% | 0 | 55 | 0.57% | 0 | no candidates | 4,652 | 47.90% | 9,710 | ||
| Total | 17,207 | 71.73% | 14 | 6,658 | 27.76% | 0 | 120 | 0.50% | 0 | 3 | 0.01% | 0 | 10,426 | 43.46% | 23,988 |
References
[edit]- ^ a b c "A New Nation Votes". elections.lib.tufts.edu. Retrieved July 24, 2024.


