From Wikipedia, the free encyclopedia
2013 Italian general election Opinion polls Registered 46,905,154 (C ) · 42,270,824 (S ) Turnout 35,270,926 (C ) · 75.2% (pp ) S ) · 75.1% (pp )
Leader
Pier Luigi Bersani
Silvio Berlusconi
Beppe Grillo
Alliance
Italy. Common Good
Centre-right
Five Star Movement
Leader since
25 October 2009
18 January 1994
4 October 2009
Leader's seat
Lombardy 1 (C )[ 1] Molise (S )[ 2] Did not run
Seats won
345 (C ) / 123 (S )
125 (C ) / 117 (S )
109 (C ) / 54 (S )
Seat change
C ) / S )
C ) / S )
New party
Coalition vote
10,049,393 (C )S )
9,923,600 (C )S )
8,691,406 (C )S )
Percentage
29.6% (C )S )
29.2% (C )S )
25.6% (C )S )
Swing
C ) S )
C ) S )
New party
Chamber of Deputies
This lists parties that won seats. See the complete results below.
Senate
This lists parties that won seats. See the complete results below.
Election results maps for the Chamber of Deputies (on the left) and for the Senate (on the right). On the left, the color identifies the coalition which received the most votes in each province. On the right, the color identifies the coalition which won the most seats in respect to each Region. Red denotes Centre-left coalitions, Blue the Centre-right coalition, Yellow the Five Star Movement, and Light Blue the Aosta Valley regional coalition.
2008 Italian general election Opinion polls Registered 47,041,814 (C ) · 42,358,775 (S ) Turnout 37,874,569 (C ) · 80.5% (pp ) S ) · 80.4% (pp )
Leader
Silvio Berlusconi
Walter Veltroni
Alliance
Centre-right
Centre-left
Leader since
18 January 1994
14 October 2007
Leader's seat
Molise (C )
Lazio 1 (C )
Seats won
344 (C ) / 174 (S )
246 (C ) / 134 (S )
Seat change
C ) / S )
C ) / S )
Coalition vote
17,403,145 (C )S )
14,099,747 (C )S )
Percentage
46.8% (C )S )
37.5% (C )S )
Swing
C ) S )
C ) S )
Chamber of Deputies
This lists parties that won seats. See the complete results below.
Senate
This lists parties that won seats. See the complete results below.
Election results maps for the Chamber of Deputies (on the left) and for the Senate (on the right). On the left, the color identifies the coalition which received the most votes in each province. On the right, the color identifies the coalition which won the most seats in respect to each Region. Blue denotes the Centre-right coalition, Red the Centre-left coalition, and Gray regional parties.
2006 Italian general election Opinion polls Registered 46,997,601 (C ) · 42,232,467 (S ) Turnout 39,298,497 (C ) · 83.6% (pp ) S ) · 83.5% (pp )
Leader
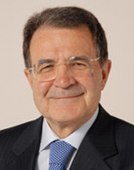
Romano Prodi
Silvio Berlusconi
Alliance
The Union
House of Freedoms
Leader since
13 September 2004
18 January 1994
Leader's seat
Emilia-Romagna (C )
Campania 1 (C )
Seats won
348 (C ) / 158 (S )
281 (C ) / 156 (S )
Seat change
C ) / S )
C ) / S )
Coalition vote
19,036,986 (C )S )
18,995,697 (C )S )
Percentage
49.8% (C )S )
49.7% (C )S )
Swing
C ) S )
C ) S )
Chamber of Deputies
This lists parties that won seats. See the complete results below.
Senate
This lists parties that won seats. See the complete results below.
Election results maps for the Chamber of Deputies (on the left) and for the Senate (on the right). Red denotes provinces and regions with a Union plurality, Blue denotes those with a House of Freedom plurality.
1992 Italian general election Registered 47,486,964 (C ) · 41,053,543 (S ) Turnout 41,479,764 (C ) · 87.4% (pp ) S ) · 86.8% (pp )
First party
Second party
Third party
Leader
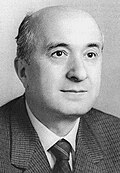
Arnaldo Forlani
Achille Occhetto
Bettino Craxi
Party
DC
PDS
PSI
Leader since
22 February 1989[ e]
21 June 1988[ f]
15 July 1976
Leader's seat
Ancona (C )
Rome (C )
Milan (C )
Seats won
206 (C ) / 107 (S )
107 (C ) / 66 (S )
92 (C ) / 49 (S )
Seat change
C ) / S )
C ) / S )
C ) / S )
Popular vote
11,637,569 (C )S )
6,317,962 (C )S )
5,343,808 (C )S )
Percentage
29.7% (C )S )
16.1% (C )S )
13.6% (C )S )
Swing
C )S )
C ) S )
C ) S )
Fourth party
Fifth party
Sixth party
Leader
Umberto Bossi
Sergio Garavini
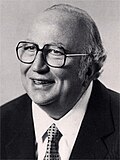
Gianfranco Fini
Party
LN
PRC
MSI
Leader since
4 December 1989
10 February 1991
6 July 1991[ g]
Leader's seat
Milan (C )
Rome (C )
Rome (C )
Seats won
55 (C ) / 25 (S )
35 (C ) / 20 (S )
34 (C ) / 16 (S )
Seat change
C ) / S )
New party
C ) / S )
Popular vote
3,396,012 (C )S )
2,204,641 (C )S )
2,107,037 (C )S )
Percentage
8.7% (C )S )
5.6% (C )S )
5.4% (C )S )
Swing
C ) S )
New party
C ) S )
Results of the election in the Chamber and Senate.
1987 Italian general election Registered 45,692,417 (C ) · 38,951,485 (S ) Turnout 40,586,573 (C ) · 88.8% (pp ) S ) · 88.4% (pp )
First party
Second party
Third party
Leader
Ciriaco De Mita
Alessandro Natta
Bettino Craxi
Party
DC
PCI
PSI
Leader since
5 May 1982
26 June 1984
15 July 1976
Leader's seat
Benevento (C )
Genoa (C )
Milan (C )
Seats won
234 (C ) / 125 (S )
177 (C ) / 101 (S )
94 (C ) / 36 (S )
Seat change
C ) / S )
C ) / S )
C ) / S )
Popular vote
13,241,188 (C ) S )
10,254,591 (C ) S )
5,505,690 (C ) S )
Percentage
34.3% (C ) S )
26.6% (C ) S )
14.3% (C ) S )
Swing
C ) S )
C ) S )
C ) S )
Fourth party
Fifth party
Sixth party
Leader
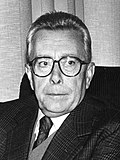
Giorgio Almirante
Giovanni Spadolini
Franco Nicolazzi
Party
MSI
PRI
PSDI
Leader since
29 June 1969[ h]
23 September 1979
6 October 1985
Leader's seat
Rome (C )
Milan (S )
Rome (C )
Seats won
35 (C ) / 16 (S )
21 (C ) / 8 (S )
17 (C ) / 5 (S )
Seat change
C ) / S )
C ) / S )
C ) / S )
Popular vote
2,281,126 (C ) S )
1,428,663 (C )S )
1,140,209 (C ) S )
Percentage
5.9% (C )S )
3.7% (C ) S )
3.0% (C ) S )
Swing
C )S )
C )S )
C )S )
Results of the election in the Chamber and Senate.
1983 Italian general election Registered 44,526,357 (C ) · 37,603,817 (S ) Turnout 39,188,182 (C ) · 88.0% (pp ) S ) · 88.8% (pp )
Majority party
Minority party
Third party
Leader
Ciriaco De Mita
Enrico Berlinguer
Bettino Craxi
Party
DC
PCI
PSI
Leader since
5 May 1982
17 March 1972
15 July 1976
Leader's seat
Benevento (C )
Rome (C )
Milan (C )
Seats won
225 (C ) / 120 (S )
198 (C ) / 107 (S )
73 (C ) / 38 (S )
Seat change
C ) / S )
C ) / S )
C ) / S )
Popular vote
12,153,081 (C ) S )
11,032,318 (C ) S )
4,223,362 (C ) S )
Percentage
32.9% (C )S )
29.9% (C ) S )
11.4% (C ) S )
Swing
C ) S )
C ) S )
C ) S )
Fourth party
Fifth party
Sixth party
Leader
Giorgio Almirante
Giovanni Spadolini
Pietro Longo
Party
MSI
PRI
PSDI
Leader since
29 June 1969[ i]
23 September 1979
20 October 1978
Leader's seat
Rome (C )
Milan (S )
Rome (C )
Seats won
42 (C ) / 18 (S )
29 (C ) / 10 (S )
23 (C ) / 8 (S )
Seat change
C ) / S )
C ) / S )
C ) / S )
Popular vote
2,511,487 (C ) S )
1,874,512 (C ) S )
1,508,234 (C ) S )
Percentage
6.8% (C )S )
5.1% (C ) S )
4.1% (C ) S )
Swing
C )S )
C )S )
C )S )
Results of the election in the Chamber and Senate.
1979 Italian general election Registered 42,203,354 (C ) · 36,362,037 (S ) Turnout 38,242,918 (C ) · 90.6% (pp ) S ) · 90.7% (pp )
Majority party
Minority party
Third party
Leader
Benigno Zaccagnini
Enrico Berlinguer
Bettino Craxi
Party
DC
PCI
PSI
Leader since
21 July 1975
17 March 1972
15 July 1976
Leader's seat
Bologna (C )
Rome (C )
Milan (C )
Seats won
262 (C ) / 138 (S )
201 (C ) / 109 (S )
62 (C ) / 32 (S )
Seat change
C ) / S )
C ) / S )
C ) / S )
Popular vote
14,046,290 (C ) S )
11,139,231 (C ) S )
3,630,052 (C ) S )
Percentage
38.3% (C ) S )
30.4% (C ) S )
9.9% (C ) S )
Swing
C ) S )
C ) S )
C ) S )
Fourth party
Fifth party
Sixth party
Leader
Giorgio Almirante
Pietro Longo
Marco Pannella
Party
MSI
PSDI
PR
Leader since
29 June 1969[ j]
20 October 1978
18 July 1976[ k]
Leader's seat
Rome (C )
Rome (C )
Rome (C )
Seats won
30 (C ) / 13 (S )
20 (C ) / 9 (S )
18 (C ) / 2 (S )
Seat change
C ) / S )
C ) / S )
C ) / S )
Popular vote
1,930,639 (C ) S )
1,407,535 (C ) S )
1,264,870 (C ) S )
Percentage
5.3% (C )S )
3.8% (C ) S )
3.5% (C ) S )
Swing
C )S )
C )S )
C )S )
Results of the election in the Chamber and Senate.
1976 Italian general election Registered 40,426,658 (C ) · 34,928,214 (S ) Turnout 37,755,090 (C ) · 93.4% (pp ) S ) · 93.4% (pp )
Majority party
Minority party
Third party
Leader
Benigno Zaccagnini
Enrico Berlinguer
Francesco De Martino
Party
DC
PCI
PSI
Leader since
21 July 1975
17 March 1972
13 March 1971[ l]
Leader's seat
Bologna (C )
Rome (C )
Naples (C )
Seats won
263 (C ) / 135 (S )
227 (C ) / 116 (S )
57 (C ) / 29 (S )
Seat change
C ) / S )
C ) / S )
C ) / S )
Popular vote
14,218,298 (C ) S )
12,622,728 (C ) S )
3,542,998 (C ) S )
Percentage
38.7% (C ) S )
34.4% (C ) S )
9.6% (C ) S )
Swing
C ) S )
C ) S )
C ) S )
Fourth party
Fifth party
Sixth party
Leader
Giorgio Almirante
Pier Luigi Romita
Oddo Biasini
Party
MSI
PSDI
PRI
Leader since
29 June 1969[ m]
10 October 1976
2 March 1975
Leader's seat
Rome (C )
Turin (C )
Bologna (C )
Seats won
30 (C ) / 13 (S )
20 (C ) / 9 (S )
14 (C ) / 6 (S )
Seat change
C ) / S )
C ) / S )
C ) / S )
Popular vote
1,930,639 (C ) S )
1,407,535 (C ) S )
1,135,546 (C ) S )
Percentage
5.3% (C )S )
3.8% (C ) S )
3.1% (C ) S )
Swing
C )S )
C )S )
C )S )
Results of the election in the Chamber and Senate.
1972 Italian general election Registered 37,049,351 (C ) · 33,739,592 (S ) Turnout 34,525,687 (C ) · 93.2% (pp ) S ) · 93.3% (pp )
Majority party
Minority party
Third party
Leader
Arnaldo Forlani
Enrico Berlinguer
Francesco De Martino
Party
DC
PCI
PSI
Leader since
9 November 1969
17 March 1972
13 March 1971[ o]
Leader's seat
Ancona (C )
Rome (C )
Naples (C )
Seats won
266 (C ) / 135 (S )
179 (C ) / 94 (S )[ n]
61 (C ) / 33 (S )
Seat change
C ) / S )
C ) / S )
—[ p]
Popular vote
12,919,270 (C ) S )
9,072,454 (C ) S )
3,210,427 (C ) S )
Percentage
38.7% (C ) S )
27.1% (C ) S )
10.0% (C ) S )
Swing
C ) S )
C )S )
—[ p]
Fourth party
Fifth party
Sixth party
Leader
Giorgio Almirante
Mario Tanassi
Giovanni Malagodi
Party
MSI
PSDI
PLI
Leader since
29 June 1969[ q]
24 February 1972[ r]
4 April 1954
Leader's seat
Rome (C )
Rome (C )
Milan (C )
Seats won
56 (C ) / 26 (S )
20 (C ) / 11 (S )
20 (C ) / 8 (S )
Seat change
C ) / S )
—[ p]
C ) / S )
Popular vote
2,894,722 (C ) S )
1,718,142 (C ) S )
1,300,439 (C ) S )
Percentage
8.7% (C )S )
5.1% (C ) S )
3.9% (C ) S )
Swing
C )S )
—[ p]
C )S )
Results of the election in the Chamber and Senate.
1968 Italian general election Registered 35,566,493 (C ) · 32,517,638 (S ) Turnout 33,001,644 (C ) · 92.8% (pp ) S ) · 93.0% (pp )
Majority party
Minority party
Third party
Leader
Mariano Rumor
Luigi Longo
Francesco De Martino [ t]
Party
DC
PCI
PSI–PSDI
Leader since
27 January 1964
22 August 1964
12 December 1963
Leader's seat
Verona (C )
Milan (C )
Naples (C )
Seats won
266 (C ) / 135 (S )
177 (C ) / 101 (S )[ s]
91 (C ) / 46 (S )
Seat change
C ) / S )
C ) / S )
C ) / S )
Popular vote
12,441,553 (C ) S )
8,557,404 (C ) S )[ s]
4,605,832 (C ) S )
Percentage
39.1% (C ) S )
26.9% (C ) S )[ s]
14.5% (C ) S )
Swing
C ) S )
C ) S )
C )[ p] S )[ p]
Fourth party
Fifth party
Sixth party
Leader
Giovanni Malagodi
Tullio Vecchietti
Arturo Michelini
Party
PLI
PSIUP
MSI
Leader since
4 April 1954
12 January 1964
10 October 1954
Leader's seat
Milan (C )
Rome (C )
Rome (C )
Seats won
31 (C ) / 16 (S )
23 (C ) / w. PCI (S )
24 (C ) / 11 (S )
Seat change
C ) / S )
New party
C ) / S )
Popular vote
1,850,650 (C ) S )
1,414,697 (C ) PCI (S )
1,414,036 (C ) S )
Percentage
5.1% (C ) S )
4.5% (C ) PCI (S )
4.5% (C )S )
Swing
C )S )
New party
C )S )
Results of the election in the Chamber and Senate.
1963 Italian general election Registered 34,199,184 (C ) · 31,019,23 (S ) Turnout 31,766,009 (C ) · 92.9% (pp ) S ) · 93.1% (pp )
Majority party
Minority party
Third party
Leader
Aldo Moro
Palmiro Togliatti
Pietro Nenni
Party
DC
PCI
PSI
Leader since
16 March 1959
15 May 1943[ u]
16 May 1949[ v]
Leader's seat
Bari (C )
Rome (S )
Milan (C )
Seats won
260 (C ) / 129 (S )
166 (C ) / 84 (S )
87 (C ) / 44 (S )
Seat change
C ) / S )
C ) /S )
C ) /S )
Popular vote
11,773,182 (C ) S )
7,767,601 (C ) S )
4,255,836 (C ) S )
Percentage
38.3% (C ) S )
25.3% (C ) S )
13.8% (C ) S )
Swing
C )S )
C ) S )
C ) S )
Fourth party
Fifth party
Sixth party
Leader
Giovanni Malagodi
Giuseppe Saragat
Arturo Michelini
Party
PLI
PSDI
MSI
Leader since
4 April 1954
11 April 1957[ w]
10 October 1954
Leader's seat
Milan (C )
Turin (C )
Rome (C )
Seats won
39 (C ) / 18 (S )
33 (C ) / 14 (S )
27 (C ) / 14 (S )
Seat change
C ) / S )
C ) / S )
C ) / S )
Popular vote
2,144,270 (C ) S )
1,876,271 (C ) S )
1,570,282 (C ) S )
Percentage
7.0% (C ) S )
6.1% (C ) S )
5.1% (C )S )
Swing
C )S )
C )S )
C )S )
Results of the election in the Chamber and Senate.
1958 Italian general election Registered 32,434,852 (C ) · 29,183,501 (S ) Turnout 30,434,681 (C ) · 93.8% (pp ) S ) · 93.9% (pp )
Majority party
Minority party
Third party
Leader
Amintore Fanfani
Palmiro Togliatti
Pietro Nenni
Party
DC
PCI
PSI
Leader since
16 July 1954
15 May 1943[ x]
16 May 1949[ y]
Leader's seat
Arezzo (C )
Rome (C )
Milan (C )
Seats won
273 (C ) / 123 (S )
140 (C ) / 59 (S )
84 (C ) / 35 (S )
Seat change
C ) / S )
C ) / S )
C ) / S )
Popular vote
12,520,207 (C ) S )
6,704,454 (C ) S )
4,206,726 (C ) S )
Percentage
42.4% (C ) S )
22.7% (C ) S )
14.2% (C ) S )
Swing
C )S )
C ) S )
C )S )
Fourth party
Fifth party
Sixth party
Leader
Arturo Michelini
Giuseppe Saragat
Giovanni Malagodi
Party
MSI
PSDI
PLI
Leader since
10 October 1954
11 April 1957[ z]
4 April 1954
Leader's seat
Rome (C )
Turin (C )
Milan (C )
Seats won
24 (C ) / 8 (S )
22 (C ) / 5 (S )
17 (C ) / 4 (S )
Seat change
C ) / S )
C ) / S )
C ) / S )
Popular vote
1,407,718 (C ) S )
1,345,447 (C ) S )
1,047,081 (C ) S )
Percentage
4.8% (C )S )
4.6% (C ) S )
3.5% (C ) S )
Swing
C )S )
C )S )
C )S )
Results of the election in the Chamber and Senate.
1953 Italian general election Registered 30,272,236 (C ) · 27,172,871 (S ) Turnout 28,406,479 (C ) · 93.8% (pp ) S ) · 93.8% (pp )
Majority party
Minority party
Third party
Leader
Alcide De Gasperi
Palmiro Togliatti
Pietro Nenni
Party
DC
PCI
PSI
Leader since
29 December 1944
15 May 1943[ aa]
16 May 1949[ ac]
Leader's seat
Trento (C )
Rome (C )
Rome (C )
Seats won
263 (C ) / 112 (S )
143 (C ) / 52 (S )
75 (C ) / 26 (S )
Seat change
C ) / S )
C ) / S )
C ) / S )
Popular vote
10,862,073 (C ) S )
6,120,809 (C ) S )
3,441,014 (C ) S )
Percentage
40.1% (C )S )
22.6% (C ) S )
12.7% (C ) S )
Swing
C )S )
—[ ab]
—[ ab]
Fourth party
Fifth party
Sixth party
Leader
Alfredo Covelli
Augusto De Marsanich
Giuseppe Saragat
Party
PNM
MSI
PSDI
Leader since
11 June 1946
10 January 1950
7 October 1952[ ad]
Leader's seat
Milan (C )
L'Aquila (C )
Turin (C )
Seats won
40 (C ) / 14 (S )
29 (C ) / 9 (S )
19 (C ) / 4 (S )
Seat change
C ) / S )
C ) / S )
C ) / S )
Popular vote
1,854,850 (C ) S )
1,582,154 (C ) S )
1,222,957 (C ) S )
Percentage
6.9% (C ) S )
5.8% (C )S )
4.5% (C ) S )
Swing
C )S )
C )S )
C )S )
Results of the election in the Chamber and Senate.
1948 Italian general election Registered 29,117,554 (C ) · 25,874,809 (S ) Turnout 26,855,741 (C ) · 92.2% S ) · 92.2%
Majority party
Minority party
Third party
Leader
Alcide De Gasperi
Palmiro Togliatti &Pietro Nenni
Giuseppe Saragat
Party
DC
FDP
US
Leader since
29 December 1944
28 December 1947
11 January 1947
Leader's seat
Trento (C )
Rome (C )Turin (C )
Seats won
305 (C ) / 131 (S )
183 (C ) / 72 (S )
33 (C ) / 10 (S )
Popular vote
12,740,042 (C ) S )
8,136,637 (C ) S )
1,858,116 (C ) S )
Percentage
48.5% (C ) S )
31.0% (C ) S )
7.1% (C ) S )
Fourth party
Fifth party
Sixth party
Leader
Roberto Lucifero
Alfredo Covelli
Randolfo Pacciardi
Party
BN
PNM
PRI
Leader since
3 December 1947
11 June 1946
20 January 1947
Leader's seat
Calabria (S )
Benevento (C )
Pisa (C )
Seats won
19 (C ) / 7 (S )
14 (C ) / 3 (S )
9 (C ) / 4 (S )
Popular vote
1,003,727 (C ) S )
729,078 (C ) S )
651,875 (C ) S )
Percentage
3.8% (C )S )
2.8% (C ) S )
2.5% (C ) S )
Results of the election in the Chamber and Senate.
Cite error: There are <ref group=lower-alpha> tags or {{efn}} templates on this page, but the references will not show without a {{reflist|group=lower-alpha}} template or {{notelist}} template (see the help page ).


