Jump to content

United States drug overdose death rates and totals over time

From Wikipedia, the free encyclopedia
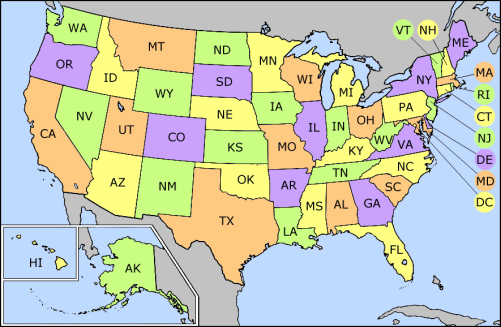
Drug overdose deaths in the US per 100,000 people by state.[1][2]
A two milligram dose of fentanyl powder (on pencil tip) is a lethal amount for most people.[3]

The United States Centers for Disease Control and Prevention (CDC) provides data on drug overdose death rates and totals in the United States.

From 1968 to 2020, approximately 1,106,900 U.S. residents died from drug overdoses, with the majority – around 932,400 – of those deaths occurring between 1999 and 2020. In 2020 alone, roughly 95,100 individuals died from drug overdoses. Since then, there were approximately 110,700 drug overdose deaths in 2021, 112,600 in 2022, and 110,000 in 2023 (over 32.8 per 100,000 US residents), showing little change in the overall rate during this period.

Of the roughly 110,700 drug overdose deaths in 2021, opioids were involved in about 80,400, or nearly 73%, of cases, with synthetic opioids other than methadone (primarily fentanyl) involved in around 70,600, or nearly 64%, of the deaths.[4][5][6][1][2]

Around 86,900 people died in the 12-month period ending September 30, 2024, at a rate of 237 deaths per day. That is 25.6 deaths per 100,000 US residents, using the population at the midpoint of that period. The CDC's "predicted value" is used for all the above yearly numbers in the intro. CDC: "Predicted provisional counts represent estimates of the number of deaths adjusted for incomplete reporting (see Technical Notes)." And the above yearly numbers are updated regularly here as they change.[4][5]

1968–2022

[edit]
U.S. yearly overdose deaths from all drugs.[7]

The numbers at the source for the table below are continually updated. So the numbers in the table below may be slightly different.[6] 2021 was a turning point in US history with over 100,000 deaths.[8]

  • Rates below are per 100,000.
  • Population is for July 1 residents.
  • Rate (by itself) is Age adjusted.
  • Total (at bottom) is 1,106,859 total deaths for 1968–2020.
1968–2020 US drug overdose deaths.[6]
Year Deaths Population Crude rate Rate
1968 5,033 199,533,564 2.5 2.8
1969 6,006 201,568,206 3.0 3.3
1970 7,101 203,458,035 3.5 3.8
1971 6,771 206,782,970 3.3 3.5
1972 6,622 209,237,411 3.2 3.4
1973 6,413 211,361,965 3.0 3.2
1974 6,449 213,436,958 3.0 3.2
1975 7,145 215,457,198 3.3 3.4
1976 6,765 217,615,788 3.1 3.2
1977 6,130 219,808,632 2.8 2.9
1978 5,506 222,102,279 2.5 2.6
1979 2,544 224,635,398 1.1 1.1
1980 2,492 226,624,371 1.1 1.1
1981 2,668 229,487,512 1.2 1.2
1982 2,862 231,701,425 1.2 1.2
1983 2,866 233,781,743 1.2 1.2
1984 3,266 235,922,142 1.4 1.3
1985 3,612 238,005,715 1.5 1.5
1986 4,187 240,189,882 1.7 1.7
1987 3,907 242,395,034 1.6 1.6
1988 4,865 244,651,961 2.0 2.0
1989 5,035 247,001,762 2.0 2.0
1990 4,506 248,922,111 1.8 1.8
1991 5,215 253,088,068 2.1 2.0
1992 5,951 256,606,463 2.3 2.3
1993 7,382 260,024,637 2.8 2.8
1994 7,828 263,241,475 3.0 3.0
1995 8,000 266,386,596 3.0 3.0
1996 8,431 269,540,779 3.1 3.1
1997 9,099 272,776,678 3.3 3.3
1998 9,838 276,032,848 3.6 3.6
1999 16,849 279,040,168 6.0 6.1
2000 17,415 281,421,906 6.2 6.2
2001 19,394 284,968,955 6.8 6.8
2002 23,518 287,625,193 8.2 8.2
2003 25,785 290,107,933 8.9 8.9
2004 27,424 292,805,298 9.4 9.4
2005 29,813 295,516,599 10.1 10.1
2006 34,425 298,379,912 11.5 11.5
2007 36,010 301,231,207 12.0 11.9
2008 36,450 304,093,966 12.0 11.9
2009 37,004 306,771,529 12.1 11.9
2010 38,329 308,745,538 12.4 12.3
2011 41,340 311,591,917 13.3 13.2
2012 41,502 313,914,040 13.2 13.1
2013 43,982 316,128,839 13.9 13.8
2014 47,055 318,857,056 14.8 14.7
2015 52,404 321,418,820 16.3 16.3
2016 63,632 323,127,513 19.7 19.8
2017 70,237 325,719,178 21.6 21.7
2018 67,367 327,167,434 20.6 20.7
2019 70,630 328,239,523 21.5 21.6
2020 91,799 329,484,123 27.9 28.3
Total 1,106,859

Death rates by state and year

[edit]

Asterisks (*) indicate Health in LOCATION or Healthcare in LOCATION links in table below.

Drug overdose death rates per 100,000 population by state.[1][9]
Location 1999 2005 2014 2015 2016 2017 2018 2019 2020 2021 2022 2023
 Alabama * 3.9 6.3 15.2 15.7 16.2 18 16.6 16.3 22.3 30.1 31.5 33.9
 Alaska * 7.5 11.4 16.8 16 16.8 20.2 14.6 17.8 22 35.6 34.3 49.4
 Arizona 10.6 14.1 12.6 19 20.3 22.2 23.8 26.8 35.8 38.7 37.2 36.1
 Arkansas * 4.4 10.1 18.2 13.8 14 15.5 15.7 13.5 19.1 22.3 21.7 17.7
 California * 8.1 9 11.1 11.3 11.2 11.7 12.8 15 21.8 26.6 26.9 27.9
 Colorado * 8 12.7 16.3 15.4 16.6 17.6 16.8 18 24.9 31.4 29.8 30.6
 Connecticut 9 8.5 17.6 22.1 27.4 30.9 30.7 34.7 39.1 42.3 40.3 35.2
 Delaware 6.4 7.5 20.9 22 30.8 37 43.8 48 47.3 54 55.3 53.0
 Florida * 6.4 13.5 13.2 16.2 23.7 25.1 22.8 25.5 35 37.5 35.2 31.7
 Georgia * 3.5 8.2 11.9 12.7 13.3 14.7 13.2 13.1 18 23.5 24.9 23.6
 Hawaii * 6.5 9.4 10.9 11.3 12.8 13.8 14.3 15.9 18.3 17.3 18.6 21.4
 Idaho * 5.3 8.1 13.7 14.2 15.2 14.4 14.6 15.1 15.9 19 20.7 20.5
 Illinois 6.7 8.4 13.1 14.1 18.9 21.6 21.3 21.9 28.1 29 30 27.3
 Indiana 3.2 9.8 18.2 19.5 24 29.4 25.6 26.6 36.7 43 41 34.2
 Iowa 1.9 4.8 8.8 10.3 10.6 11.5 9.6 11.5 14.3 15.3 15.3 14.9
 Kansas 3.4 9.1 11.7 11.8 11.1 11.8 12.4 14.3 17.4 24.3 26.5 22.8
 Kentucky 4.9 15.3 24.7 29.9 33.5 37.2 30.9 32.5 49.2 55.6 53.2 48.0
 Louisiana 4.3 14.7 16.9 19 21.8 24.5 25.4 28.3 42.7 55.9 54.5 50.6
 Maine 5.3 12.4 16.8 21.2 28.7 34.4 27.9 29.9 39.7 47.1 54.3 44.9
 Maryland * 11.4 11.4 17.4 20.9 33.2 36.3 37.2 38.2 44.6 42.8 40.3 39.3
 Massachusetts * 7.5 12 19 25.7 33 31.8 32.8 32.1 33.9 36.8 37.4 33.6
 Michigan 4.6 9.8 18 20.4 24.4 27.8 26.6 24.4 28.6 31.5 30.7 28.9
 Minnesota * 2.8 5.4 9.6 10.6 12.5 13.3 11.5 14.2 19 24.5 24.8 23.6
 Mississippi * 3.2 8.8 11.6 12.3 12.1 12.2 10.8 13.6 21.1 28.4 27.6 25.3
 Missouri 5 10.7 18.2 17.9 23.6 23.4 27.5 26.9 32.1 36.5 36.9 33.5
 Montana * 4.6 10.1 12.4 13.8 11.7 11.7 12.2 14.1 15.6 19.5 19.4 17.1
 Nebraska 2.3 5 7.2 6.9 6.4 8.1 7.4 8.7 11.3 11.4 11.8 9.0
 Nevada 11.5 18.7 18.4 20.4 21.7 21.6 21.2 20.1 26 29.2 30.3 38.1
 New Hampshire 4.3 10.7 26.2 34.3 39 37 35.8 32 30.3 32.3 36 32.7
 New Jersey 6.5 9.4 14 16.3 23.2 30 33.1 31.7 32.1 32.4 31.6 28.3
 New Mexico 15 20.1 27.3 25.3 25.2 24.8 26.7 30.2 39 51.6 50.3 48.9
 New York * 5 4.8 11.3 13.6 18 19.4 18.4 18.2 25.4 28.7 31.4 31.1
 North Carolina * 4.6 11.4 13.8 15.8 19.7 24.1 22.4 22.3 30.9 39.2 41.8 33.7
 North Dakota * 0 0 6.3 8.6 10.6 9.2 10.2 11.4 15.6 17.2 19.8 16.4
 Ohio * 4.2 10.9 24.6 29.9 39.1 46.3 35.9 38.3 47.2 48.1 45.6 41.6
 Oklahoma * 5.4 13.8 20.3 19 21.5 20.1 18.4 16.7 19.4 24.4 30.7 32.4
 Oregon * 6.1 10.4 12.8 12 11.9 12.4 12.6 14 18.7 26.8 31.1 40.8
 Pennsylvania 8.1 13.2 21.9 26.3 37.9 44.3 36.1 35.6 42.4 43.2 40.9 37.1
 Rhode Island 5.5 14.3 23.4 28.2 30.8 31 30.1 29.5 38.2 41.7 38.1 37.5
 South Carolina * 3.7 9.9 14.4 15.7 18.1 20.5 22.6 22.7 34.9 42.8 44.7 41.3
 South Dakota 0 5.5 7.8 8.4 8.4 8.5 6.9 10.5 10.3 12.6 11.3 11.2
 Tennessee 6.1 14.5 19.5 22.2 24.5 26.6 27.5 31.2 45.6 56.6 56 52.3
 Texas * 5.4 8.5 9.7 9.4 10.1 10.5 10.4 10.8 14.1 16.8 18.2 18.5
 Utah * 10.6 19.3 22.4 23.4 22.4 22.3 21.2 18.9 20.5 21.1 19.8 21.4
 Vermont * 4.7 8.5 13.9 16.7 22.2 23.2 26.6 23.8 32.9 42.3 45.9 42.3
 Virginia * 5 7.5 11.7 12.4 16.7 17.9 17.1 18.3 26.6 30.5 28.8 28.5
 Washington * 9.3 13 13.3 14.7 14.5 15.2 14.8 15.8 22 28.1 33.7 42.4
 Washington, D.C. * 64.3 60.7
 West Virginia * 4.1 10.5 35.5 41.5 52 57.8 51.5 52.8 81.4 90.9 80.9 81.9
 Wisconsin 4 9.3 15.1 15.5 19.3 21.2 19.2 21.1 27.7 31.6 31.8 30.6
 Wyoming 4.1 4.9 19.4 16.4 17.6 12.2 11.1 14.1 17.4 18.9 21.9 23.7

Death counts by state over time

[edit]

Overall US totals by year, followed by breakdown by state by year.[1]

Overall US totals by year
1999 2005 2014 2015 2016
Total 16,801 29,736 46,959 52,279 63,363
Overall US totals by year
2017 2018 2019 2020 2021 2022
Total 69,927 67,113 70,319 91,375 106,249 107,941

Location links below are "Category:Health in LOCATION" links. See overall category.

Drug overdose death counts by state over time.[1]
Location 1999 2005 2014 2015 2016 2017 2018 2019 2020 2021 2022
 Alaska 46 79 124 122 128 147 110 132 160 260 254
 Alabama 169 283 723 736 756 835 775 768 1,029 1,408 1,492
 Arkansas 113 269 1,211 392 401 446 444 388 546 637 617
 Arizona 511 794 356 1,274 1,382 1,532 1,670 1,907 2,550 2,730 2,664
 California 2,662 3,214 4,521 4,659 4,654 4,868 5,348 6,198 8,908 10,901 10,952
 Colorado 349 608 899 869 942 1,015 995 1,079 1,492 1,887 1,811
 Connecticut 310 295 623 800 971 1,072 1,069 1,214 1,371 1,552 1,482
 Delaware 50 62 189 198 282 338 401 435 444 513 549
 Florida 997 2,371 2,634 3,228 4,728 5,088 4,698 5,268 7,231 7,827 7,551
 Georgia 283 738 1,206 1,302 1,394 1,537 1,404 1,408 1,916 2,500 2,687
 Hawaii 80 126 157 169 191 203 213 242 274 269 284
 Iowa 53 141 264 309 314 341 287 352 432 475 469
 Idaho 64 109 212 218 243 236 250 265 287 354 385
 Illinois 825 1,067 1,705 1,835 2,411 2,778 2,722 2,790 3,549 3,762 3,849
 Indiana 191 610 1,172 1,245 1,526 1,852 1,629 1,699 2,321 2,811 2,682
 Kansas 89 241 332 329 313 333 345 403 490 680 754
 Kentucky 197 638 1,077 1,273 1,419 1,566 1,315 1,380 2,083 2,381 2,271
 Louisiana 188 661 777 861 996 1,108 1,140 1,267 1,896 2,463 2,376
 Massachusetts 488 780 1,289 1,724 2,227 2,168 2,241 2,210 2,302 2,585 2,642
 Maryland 629 656 1,070 1,285 2,044 2,247 2,324 2,369 2,771 2,737 2,573
 Maine 67 163 216 269 353 424 345 371 496 611 707
 Michigan 460 985 1,762 1,980 2,347 2,694 2,591 2,385 2,759 3,089 2,997
 Minnesota 136 282 517 581 672 733 636 792 1,050 1,356 1,384
 Missouri 276 608 1,067 1,066 1,371 1,367 1,610 1,583 1,875 2,155 2,192
 Mississippi 87 248 336 351 352 354 310 394 586 787 758
 Montana 41 96 125 138 119 119 125 143 162 199 208
 North Carolina 366 1,000 1,358 1,567 1,956 2,414 2,259 2,266 3,146 3,981 4,310
 North Dakota 12 12 43 61 77 68 70 82 114 124 148
 Nebraska 39 86 125 126 120 152 138 161 214 214 225
 New Hampshire 54 142 334 422 481 467 452 407 393 441 486
 New Jersey 557 823 1,253 1,454 2,056 2,685 2,900 2,805 2,840 3,056 2,985
 New Mexico 266 373 547 501 500 493 537 599 784 1,052 1,024
 Nevada 227 457 545 619 665 676 688 647 832 949 1,003
 New York 959 944 2,300 2,754 3,638 3,921 3,697 3,617 4,965 5,842 6,358
 Ohio 467 1,243 2,744 3,310 4,329 5,111 3,980 4,251 5,204 5,397 5,144
 Oklahoma 178 478 777 725 813 775 716 645 762 960 1,196
 Oregon 210 386 522 505 506 530 547 615 803 1,171 1,363
 Pennsylvania 990 1,613 2,732 3,264 4,627 5,388 4,415 4,377 5,168 5,449 5,169
 Rhode Island 58 156 247 310 326 320 317 307 397 455 424
 South Carolina 147 427 701 761 879 1,008 1,125 1,127 1,739 2,138 2,279
 South Dakota 17 40 63 65 69 73 57 86 83 105 95
 Tennessee 344 872 1,269 1,457 1,630 1,776 1,823 2,089 3,034 3,813 3,825
 Texas 1,087 1,910 2,601 2,588 2,831 2,989 3,005 3,136 4,172 4,984 5,489
 Utah 205 438 603 646 635 650 624 571 622 662 627
 Virginia 366 581 980 1,039 1,405 1,507 1,448 1,547 2,240 2,626 2,496
 Vermont 29 53 83 99 125 134 153 133 190 252 276
 Washington 555 850 979 1,094 1,102 1,169 1,164 1,259 1,733 2,264 2,725
 Washington, D.C. 451
 Wisconsin 212 518 853 878 1,074 1,177 1,079 1,201 1,531 1,775 1,792
 West Virginia 75 184 627 725 884 974 856 870 1,330 1,501 1,335
 Wyoming 20 26 109 96 99 69 66 79 99 109 126

For convenience, and as a geographic aid, the "Category:Health in STATE" links are also in this map. Click on any state.

Category:Health in Washington (state)Category:Health in OregonCategory:Health in CaliforniaCategory:Health in HawaiiCategory:Health in AlaskaCategory:Health in IdahoCategory:Health in VermontCategory:Health in New HampshireCategory:Health in MassachusettsCategory:Health in Rhode IslandCategory:Health in ConnecticutCategory:Health in New JerseyCategory:Health in DelawareCategory:Health in MarylandCategory:Health in Washington, D.C.Category:Health in MontanaCategory:Health in North DakotaCategory:Health in South DakotaCategory:Health in NevadaCategory:Health in UtahCategory:Health in ArizonaCategory:Health in WyomingCategory:Health in ColoradoCategory:Health in New MexicoCategory:Health in NebraskaCategory:Health in KansasCategory:Health in OklahomaCategory:Health in TexasCategory:Health in MinnesotaCategory:Health in IowaCategory:Health in MissouriCategory:Health in ArkansasCategory:Health in LouisianaCategory:Health in MichiganCategory:Health in WisconsinCategory:Health in IllinoisCategory:Health in IndianaCategory:Health in OhioCategory:Health in West VirginiaCategory:Health in KentuckyCategory:Health in TennesseeCategory:Health in MississippiCategory:Health in AlabamaCategory:Health in Georgia (U.S. state)Category:Health in FloridaCategory:Health in South CarolinaCategory:Health in North CarolinaCategory:Health in VirginiaCategory:Health in MarylandCategory:Health in MarylandCategory:Health in Washington, D.C.Category:Health in DelawareCategory:Health in New York (state)Category:Health in PennsylvaniaCategory:Health in New JerseyCategory:Health in ConnecticutCategory:Health in Rhode IslandCategory:Health in MassachusettsCategory:Health in New HampshireCategory:Health in VermontCategory:Health in Maine

Timeline by drug

[edit]

Concerning the data in the charts below (in this section and the following sections) deaths from the various drugs add up to more than the yearly overdose death total because multiple drugs are involved in many of the deaths.[7]

US yearly overdose deaths, and the drugs involved.[7]

Opioid charts

[edit]
Fentanyl. 2 mg (white powder to the right) is a lethal dose in most people.[10][11] US penny is 19 mm (0.75 in) wide.

Opioids were involved in around 80,400 of the around 106,700 deaths in 2021.[7] See map higher up for states with the highest overdose death rates.

Three waves of opioid overdose deaths.[12]
U.S. overdose deaths involving all opioids. Deaths per 100,000 population.[13]
US yearly deaths from all opioid drugs. Included in this number are opioid analgesics, along with heroin and illicit synthetic opioids.[7]
US yearly deaths involving other synthetic opioids, predominately Fentanyl.[7]
US yearly deaths involving prescription opioids. Non-methadone synthetics is a category dominated by illegally acquired fentanyl, and has been excluded.[7]
US overdose deaths involving heroin, by other opioid involvement.[7]
Timeline of US overdose deaths involving stimulants (cocaine and psychostimulants), by opioid involvement.[7]
US overdose deaths involving psychostimulants with abuse potential (primarily methamphetamine), by opioid involvement.
Opioid involvement in cocaine overdose deaths.[7]
The top line represents the yearly number of benzodiazepine deaths that involved opioids in the US. The bottom line represents benzodiazepine deaths that did not involve opioids.[7]
Drug overdose deaths involving antidepressants, by opioid involvement.[7]

Rate timeline by race and ethnicity

[edit]
Timeline of US drug overdose death rates by race and ethnicity.[14] Rate per 100,000 population.

Rate timeline by sex

[edit]
Timeline of US drug overdose death rates by sex,[15] Rate per 100,000 population.

Comparisons to other countries in Europe

[edit]

Rates

[edit]
  • Location links are "Healthcare in LOCATION" links.
Drug-induced mortality rates per million among adults (15-64), females, males and total.[16]
Location Year Females Males Total
 Austria 2022 18 65 42
 Belgium 2020 7 34 21
 Bulgaria 2022 1 8 4
 Croatia 2022 13 71 42
 Cyprus 2022 3 13 8
 Czech Republic 2022 6 12 9
 Denmark 2021 19 60 40
 Estonia 2022 34 155 95
 Finland 2022 33 106 70
 France 2016 3 16 9
 Germany 2022 10 49 30
 Greece 2020 10 58 34
 Hungary 2021 3 9 6
 Ireland 2020 64 130 97
 Italy 2022 2 13 8
 Latvia 2022 12 96 53
 Lithuania 2022 10 86 47
 Luxembourg 2022 5 31 18
 Malta 2020 6 43 26
 Netherlands 2022 13 40 26
 Norway 2022 53 118 86
 Poland 2021 5 11 8
 Portugal 2021 4 19 11
 Romania 2022 1 3 2
 Slovakia 2021 3 12 7
 Slovenia 2022 16 74 46
 Spain 2021 7 34 21
 Sweden 2022 35 102 70
 Turkey 2022 1 7 4

Counts

[edit]
  • Location links are "Healthcare in LOCATION" links.
Drug overdose deaths in Europe per year by country.[17]
Location 2022 2021 2020 2019 2018 2017
 Austria 248 235 191 196 184 154
 Belgium 172 168 152 148
 Bulgaria 20 20 24 11 24 18
 Croatia 102 77 99 97 85 65
 Cyprus 5 10 6 5 12 16
 Czech Republic 64 64 58 42 39 42
 Denmark 184 199 203 183 239
 Estonia 82 39 33 27 39 110
 Finland 250 287 258 234 261 200
 France 417
 Germany 1,631 1,466 1,581 1,398 1,276 1,272
 Greece 230 230 274 255
 Hungary 42 48 43 33 33
 Ireland 322 298 266 235
 Italy 298 296 309 374 336 297
 Latvia 63 17 21 12 20 22
 Lithuania 87 62 47 52 59 83
 Luxembourg 8 5 6 8 4 8
 Malta 5 9 4 3 5
 Netherlands 332 298 295 252 224 262
 Norway 321 241 324 275 286 247
 Poland 289 229 212 199 202
 Portugal 81 63 72 55 51
 Romania 27 30 33 45 26 32
 Slovakia 28 37 34 32 19
 Slovenia 66 65 70 74 59 47
 Spain 820 774 546 450 437
 Sweden 519 450 524 555 583 643
 Turkey 246 270 314 342 657 941
 United Kingdom 3,284

See also

[edit]

References

[edit]
  1. ^ a b c d e Drug Overdose Mortality by State. Pick year from menu below map. From National Center for Health Statistics for the Centers for Disease Control and Prevention. The numbers are in the data table below the map, and by running your cursor over the map at the source. CSV data link below table.
  2. ^ a b Death Rate Maps & Graphs | Drug Overdose. Centers for Disease Control and Prevention, National Center for Injury Prevention and Control. Click on a map year. The data table is below the map. Number of deaths for each state, and the age-adjusted rates of death for each state. Also, place cursor on map states to get data.
  3. ^ "One Pill Can Kill". US Drug Enforcement Administration. Archived from the original on 15 Nov 2023. Retrieved 15 Nov 2023.
  4. ^ a b Products - Vital Statistics Rapid Release - Provisional Drug Overdose Data. Centers for Disease Control and Prevention. Hover cursor over the end of the graph in Figure 1A to get the latest number. Scroll down the page and click on the dropdown data table called "Data Table for Figure 1a. 12 Month-ending Provisional Counts of Drug Overdose Deaths". The number used is the "predicted value" for the 12-month period that is ending at the end of that month. That number changes as more info comes in. See "Technical Notes". If there are problems use a different browser.
  5. ^ a b US Population by Month. US resident population. Source: US Census Bureau. Population from the middle of the 12-month period is used to calculate the death rate. See WP:CALC.
  6. ^ a b c Data is from these saved tables from CDC Wonder at the Centers for Disease Control and Prevention, National Center for Health Statistics. The tables have totals, rates, and US populations per year. The numbers are continually updated: "This dataset has been updated since this request was saved, which could lead to differences in results." So the numbers in the table at the source may be slightly different.
  7. ^ a b c d e f g h i j k l Drug Overdose Death Rates. By National Institute on Drug Abuse (NIDA). See "Download Links" section near the bottom of the page for the latest data link, and a PowerPoint link.
  8. ^ Yousif, Nadine (September 17, 2023). "How the fentanyl crisis' fourth wave has hit every corner of the US". BBC News.
  9. ^ Changes in Drug Overdose Mortality and Selected Drug Type by State: United States, 2022 to 2023. By Matthew F. Garnett, M.P.H., and Arialdi M. Miniño, M.P.H. National Center for Health Statistics for the Centers for Disease Control and Prevention.
  10. ^ Fentanyl. Image 4 of 17. US DEA (Drug Enforcement Administration). See archive with caption: "photo illustration of 2 milligrams of fentanyl, a lethal dose in most people".
  11. ^ Facts About Fentanyl. From US Drug Enforcement Administration.
  12. ^ Understanding the Opioid Overdose Epidemic. See large image. Centers for Disease Control and Prevention.
  13. ^ Opioid Data Analysis and Resources. Drug Overdose. CDC Injury Center. Centers for Disease Control and Prevention. Click on "Rising Rates" tab for a graph. See the data table below the graph.
  14. ^ NCHS Data Visualization Gallery - Drug Poisoning Mortality. From National Center for Health Statistics. Open the dashboard dropdown menu and pick "U.S. Trends". From the menus on the right pick all races, all ages, and both sexes. Run your cursor over the graph to see the data.
  15. ^ Drug Overdose Deaths in the United States, 2001–2021. NCHS Data Brief No. 457, December 2022.. From National Center for Health Statistics. Scroll down to Figure 1. Right-click the image, and then click "Open link in new tab" to get the larger PNG image. 2001-2021 chart.
  16. ^ "Overdose situation (FAQ drug overdose deaths in Europe)". European Union Drugs Agency. Scroll down to Figure 1.5. Then; "Show data table".
  17. ^ "Statistical Bulletin 2024 — drug-induced deaths". European Union Drugs Agency. "Trends > National definition > Number of deaths > Total" table. Retrieved 5 March 2025.

Further reading

[edit]