This article is within the scope of WikiProject Geography, a collaborative effort to improve the coverage of geography on Wikipedia. If you would like to participate, please visit the project page, where you can join the discussion and see a list of open tasks.GeographyWikipedia:WikiProject GeographyTemplate:WikiProject Geographygeography
This article is within the scope of WikiProject Statistics, a collaborative effort to improve the coverage of statistics on Wikipedia. If you would like to participate, please visit the project page, where you can join the discussion and see a list of open tasks.StatisticsWikipedia:WikiProject StatisticsTemplate:WikiProject StatisticsStatistics
The second figure introduces a bunch of stuff not explained or even mentioned elsewhere in the article.
What is a hand map? Hand drawn?
What is the q statistic?
What is a strata? What is their purpose and how are they chosen?
Some of the ps and qs have subscripts denoting rather strange combinations of these strata. What motivates this? What does it mean when there is no subscript?
I don't think any of this stuff is standard in discussions of Moran's index (nothing I've ever come across...) and it's so confusing I'd suggest deleting it. WikiNukalito (talk) 19:39, 17 April 2024 (UTC)[reply]
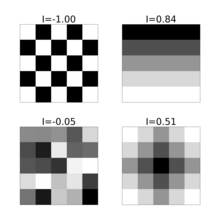
Suggest replacing with this, simpler, figure
Moran's I statistic computed for different spatial patterns. Using 'rook' neighbors for each grid cell, setting for neighbours of and then row normalizing the weight matrix. Top left shows anti-correlation giving a negative I. Top right shows a spatial gradient giving a large positive I. Bottom left shows random data giving a value of I near 0 (or ). Bottom right shows an 'ink blot' or spreading pattern with positive autocorrelation.WikiNukalito (talk) 20:25, 17 April 2024 (UTC)[reply]