
Texas's 17th congressional district
| Texas's 17th congressional district | |
|---|---|
 Texas's 17th congressional district since January 3, 2023 | |
| Representative | |
| Distribution |
|
| Population (2023) | 800,590[2] |
| Median household income | $66,873[3] |
| Ethnicity |
|
| Cook PVI | R+14[4] |
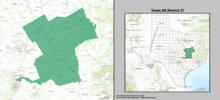
Texas's 17th congressional district of the United States House of Representatives includes a strip of Central Texas and Deep East Texas stretching from Nacogdoches to Waco and Round Rock, including former President George W. Bush's McLennan County ranch.[5][6] The district is currently represented by Republican Pete Sessions.
From 2005 to 2013, it was an oblong district stretching from south of Tarrant County to Grimes County in the southeast. The 2012 redistricting made its area more square, removing the northern and southeastern portions, adding areas southwest into the northern Austin suburbs and east into Freestone and Leon counties. The district included two major universities, Texas A&M University in College Station and Baylor University in Waco.
Before 2005, the district stretched from the Abilene area to the outer western fringes of the Dallas-Fort Worth Metroplex.
History
[edit]After the 2003 Texas redistricting, engineered by former House Majority Leader Tom DeLay, TX-17 was (along with MS-4) the most heavily Republican district in the nation to be represented by a Democrat, according to the Cook Partisan Voting Index, which rated it R+20.[7] The district was drawn to make it Republican-dominated and unseat its longtime incumbent, conservative Democrat Chet Edwards. While several of his colleagues were defeated by Republicans in 2004, Edwards held on to the seat in the 2004, 2006 and 2008 elections.
But in the 2010 Congressional elections, the district elected Republican Bill Flores over Edwards by a margin of 61.8% to 36.6%.[8] Flores was the first Republican to be elected to represent the district since its creation in 1919. Flores retired after five terms and former Texas 32nd district Congressman Pete Sessions, a Waco native, was elected in 2020.
After passage of civil rights legislation and other changes, through the late 20th and early 21st centuries, white conservatives began to shift into the Republican Party in Texas. They first supported presidential candidates, and gradually more Republicans for local, state and national office, resulting in the 2010 switch in party representation.
Composition
[edit]For the 118th and successive Congresses (based on redistricting following the 2020 census), the district contains all or portions of the following counties and communities:[9]
Angelina County (7)
- All 7 communities
Falls County (5)
- All 5 communities
Freestone County (1)
Houston County (5)
- All 5 communities
Leon County (8)
- All 8 communities
Limestone County (6)
- All 6 communities
McLennan County (23)
- All 23 communities
Milam County (9)
- All 9 communities
- All 6 communities
Robertson County (4)
- All 4 communities
Travis County (2)
- Pflugerville (part; also 17th, 35th, and 37th; shared with Williamson County), Round Rock (part; also 17th and 31st; shared with Travis County)
Trinity County (3)
- All 3 communities
Walker County (2)
- Huntsville (part; also 8th), Riverside
- Coupland, Hutto (part; also 31st), Pflugerville (part; also 17th, 35th, and 37th; shared with Travis County), Round Rock (part; also 17th and 31st; shared with Travis County), Thrall (part; also 31st)
List of members representing the district
[edit]
.jpg)


Recent election results from statewide races
[edit]| Year | Office | Results[10][11] |
|---|---|---|
| 2008 | President | McCain 61% - 38% |
| 2012 | President | Romney 65% - 35% |
| 2014 | Senate | Cornyn 72% - 28% |
| Governor | Abbott 69% - 31% | |
| 2016 | President | Trump 62% - 34% |
| 2018 | Senate | Cruz 61% - 39% |
| Governor | Abbott 64% - 34% | |
| Lt. Governor | Patrick 59% - 38% | |
| Attorney General | Paxton 60% - 38% | |
| 2020 | President | Trump 61% - 38% |
| Senate | Cornyn 61% - 36% | |
| 2022 | Governor | Abbott 65% - 34% |
| Lt. Governor | Patrick 64% - 34% | |
| Attorney General | Paxton 63% - 34% | |
| Comptroller of Public Accounts | Hegar 66% - 32% |
Election results
[edit]| Party | Candidate | Votes | % | ±% | |
|---|---|---|---|---|---|
| Republican | Pete Sessions (incumbent) | 144,408 | 66.48 | +10.5 | |
| Democratic | Mary Jo Woods | 72,801 | 33.52 | −7.4 | |
| Total votes | 217,209 | 100.0 | |||
| Republican hold | Swing | +10.5 | |||
| Party | Candidate | Votes | % | ±% | |
|---|---|---|---|---|---|
| Republican | Pete Sessions | 171,390 | 55.9 | −0.9 | |
| Democratic | Rick Kennedy | 125,565 | 40.92 | −0.4 | |
| Libertarian | Ted Brown | 9,918 | 3.2 | +1.3 | |
| Majority | 45,825 | 14.9 | |||
| Turnout | 306,873 | ||||
| Republican hold | Swing | -0.9 | |||
| Party | Candidate | Votes | % | ±% | |
|---|---|---|---|---|---|
| Republican | Bill Flores (incumbent) | 134,841 | 56.8 | −4.01 | |
| Democratic | Rick Kennedy | 98,070 | 41.3 | +6.06 | |
| Libertarian | Clark Patterson | 4,440 | 1.9 | −2.05 | |
| Majority | 36,771 | 15.5 | |||
| Turnout | 237,351 | ||||
| Republican hold | Swing | -4.01 | |||
| Party | Candidate | Votes | % | ±% | |
|---|---|---|---|---|---|
| Republican | Bill Flores (incumbent) | 149,417 | 60.81 | −3.77 | |
| Democratic | William Matta | 86,603 | 35.24 | +2.84 | |
| Libertarian | Clark Patterson | 9,708 | 3.95 | +0.93 | |
| Majority | 53,106 | 21.6 | |||
| Turnout | 245,728 | ||||
| Republican hold | Swing | -3.77 | |||
| Party | Candidate | Votes | % | ±% | |
|---|---|---|---|---|---|
| Republican | Bill Flores (incumbent) | 85,807 | 64.58 | −15.35 | |
| Democratic | Nick Haynes | 43,049 | 32.4 | ||
| Libertarian | Shawn Michael Hamilton | 4,009 | 3.02 | −17.05 | |
| Majority | 38,749 | 29.16 | |||
| Turnout | 132,865 | ||||
| Republican hold | Swing | -15.35 | |||
| Party | Candidate | Votes | % | ±% | |
|---|---|---|---|---|---|
| Republican | Bill Flores (incumbent) | 143,284[12] | 79.93 | +34.8 | |
| Libertarian | Ben Easton | 35,978 | 20.07 | 119 | |
| Majority | 107,306 | ||||
| Turnout | 179,262 | 4.23 | |||
| Republican hold | Swing | +18.14 | |||
| Party | Candidate | Votes | % | ±% | |
|---|---|---|---|---|---|
| Republican | Bill Flores | 106,275 | 61.79 | +16.28 | |
| Democratic | Chet Edwards (incumbent) | 62,926 | 36.59 | −16.39 | |
| Libertarian | Richard Kelly | 2,787 | 1.62 | +0.11 | |
| Majority | 43,349 | 25.2 | +17.73 | ||
| Turnout | 171,988 | ||||
| Republican gain from Democratic | Swing | +16.34 | |||
| Party | Candidate | Votes | % | ±% | |
|---|---|---|---|---|---|
| Democratic | Chet Edwards (incumbent) | 134,592 | 52.98 | −5.14 | |
| Republican | Rob Curnock | 115,581 | 45.51 | +5.21 | |
| Libertarian | Gardner C. Osbourne | 3,849 | 1.51 | −0.07 | |
| Majority | 19,011 | 7.47 | −10.35 | ||
| Turnout | 254,022 | ||||
| Democratic hold | Swing | -5.18 | |||
| Party | Candidate | Votes | % | ±% | |
|---|---|---|---|---|---|
| Democratic | Chet Edwards (incumbent) | 92,478 | 58.12 | +6.92 | |
| Republican | Van Taylor | 64,142 | 40.30 | −7.11 | |
| Libertarian | Guillermo Acosta | 2,504 | 1.58 | +0.19 | |
| Majority | 28,336 | 17.82 | +14.03 | ||
| Turnout | 159,124 | ||||
| Democratic hold | Swing | +7.02 | |||
| Party | Candidate | Votes | % | ±% | |
|---|---|---|---|---|---|
| Democratic | Chet Edwards | 125,309 | 51.20 | −0.17 | |
| Republican | Arlene Wohlgemuth | 116,049 | 47.41 | +0.03 | |
| Libertarian | Clyde Garland | 3,390 | 1.39 | +0.14 | |
| Majority | 9,260 | 3.79 | −0.19 | ||
| Turnout | 244,748 | ||||
| Democratic hold | Swing | -0.1 | |||
| Party | Candidate | Votes | % | ±% | |
|---|---|---|---|---|---|
| Democratic | Charlie Stenholm (incumbent) | 84,136 | 51.37 | ||
| Republican | Rob Beckham | 77,622 | 47.38 | ||
| Libertarian | Fred Jones | 2,046 | 1.25 | ||
| Majority | 6,514 | 3.98 | |||
| Turnout | 163,804 | ||||
| Democratic hold | Swing | ||||
Historical district boundaries
[edit]
See also
[edit]References
[edit]- ^ "Congressional Districts Relationship Files (state-based)". www.census.gov. US Census Bureau Geography.
- ^ "My Congressional District". www.census.gov. Center for New Media & Promotion (CNMP), US Census Bureau.
- ^ "My Congressional District". www.census.gov. Center for New Media & Promotion (CNMP), US Census Bureau.
- ^ "2022 Cook PVI: District Map and List". Cook Political Report. Retrieved January 10, 2023.
- ^ "Pelosi continues to tout Texas Rep. Chet Edwards for VP". Texas on the Potomac (blog). Houston Chronicle. August 3, 2008. Retrieved October 21, 2012.
- ^ Vlahos, Kelley (March 7, 2006). "Texas Rep. Edwards Beats Odds, but Faces Iraq War Vet in Midterm". Fox News. Retrieved March 25, 2007.
- ^ Texas 17th District Profile Congressional Quarterly. May 14, 2010.
- ^ 2010 Texas Election Results New York Times. November 13, 2010.
- ^ https://www2.census.gov/geo/maps/cong_dist/cd118/cd_based/ST48/CD118_TX17.pdf
- ^ https://davesredistricting.org/maps#viewmap::1c2c1e0d-2fd1-43a8-a039-73e7023124d1
- ^ texas 2020 pres-by-newCD. docs.google.com (Report).
- ^ United States House of Representatives elections in Texas, 2012#District 17
Sources
[edit]- Martis, Kenneth C. (1989). The Historical Atlas of Political Parties in the United States Congress. New York: Macmillan Publishing Company.
- Martis, Kenneth C. (1982). The Historical Atlas of United States Congressional Districts. New York: Macmillan Publishing Company.
- Congressional Biographical Directory of the United States 1774–present