
Texas's 11th congressional district
| Texas's 11th congressional district | |
|---|---|
 Texas's 11th congressional district since January 3, 2023 | |
| Representative | |
| Distribution |
|
| Population (2023) | 790,592[2] |
| Median household income | $67,226[3] |
| Ethnicity |
|
| Cook PVI | R+23[4] |
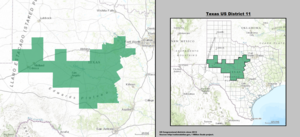
Texas's 11th congressional district of the United States House of Representatives is in the midwestern portion of the state of Texas, stretching from the Permian Basin through the Hill Country. Major cities in the district include: Andrews, Midland, Odessa, San Angelo, Killeen, and Brownwood. The current Representative from the 11th district is Republican August Pfluger.
Texas has had at least 11 districts since 1883. The current configuration dates from the 2003 Texas redistricting; its first congressman, Mike Conaway, took office in 2005. It is one of the most Republican districts in the nation. Much of the territory now in the district began shaking off its Democratic roots far sooner than the rest of Texas. For instance, Barry Goldwater did very well in much of this area in 1964, and Midland itself last supported a Democrat for president in 1948. While Democrats continued to hold most local offices here well into the 1980s and continued to represent parts of the region through the 1990s, today Republicans dominate every level of government, usually winning by well over 70 percent of the vote. There are almost no elected Democrats left above the county level.
It was President George W. Bush's strongest district in the entire nation in the 2004 election. Since its creation, the Republicans have never dropped below 75 percent of the vote. The Democrats have only put up a candidate five times, only one of whom has even won 20 percent of the vote.
Conaway retired at the end of his eighth term in 2021. Pfluger won the Republican primary to succeed him. With Republicans having a nearly 10-to-1 advantage in registration, he was all but assured of victory in the general election.[5]
From 1903-2005 the district was based in central Texas and contained Waco.
Composition
[edit]For the 118th and successive Congresses (based on redistricting following the 2020 census), the district contains all or portions of the following counties and communities:[6]
Bell County (1)
Brown County (8)
- All 8 communities
Coke County (3)
- All 3 communities
Coleman County (4)
- All 4 communities
Concho County (2)
Ector County (4)
- All 4 communities
Glasscock County (1)
Irion County (1)
Kimble County (1)
Lampasas County (4)
- All 4 communities
Llano County (7)
- All 7 communities
Mason County (1)
McCulloch County (3)
- All 3 communities
Menard County (1)
Midland County (2)
- Midland (part; also 19th; shared with Martin County), Odessa (shared with Ector County)
Mills County (3)
- All 3 communities
Runnels County (5)
- All 5 communities
San Saba County (2)
Sterling County (1)
Tom Green County (4)
- All 4 communities
List of members representing the district
[edit]


_2.jpg)


Recent election results from statewide races
[edit]| Year | Office | Results[10] |
|---|---|---|
| 2008 | President | McCain 69% - 30% |
| 2012 | President | Romney 73% - 27% |
| 2014 | Senate | Cornyn 81% - 19% |
| Governor | Abbott 79% - 21% | |
| 2016 | President | Trump 69% - 27% |
| 2018 | Senate | Cruz 69% - 30% |
| Governor | Abbott 72% - 26% | |
| Lt. Governor | Patrick 68% - 30% | |
| Attorney General | Paxton 68% - 29% | |
| 2020 | President | Trump 69% - 29% |
| Senate | Cornyn 70% - 28% | |
| 2022 | Governor | Abbott 74% - 25% |
| Lt. Governor | Patrick 72% - 25% | |
| Attorney General | Paxton 72% - 25% | |
| Comptroller of Public Accounts | Hegar 74% - 24% |
Recent election results
[edit]| Party | Candidate | Votes | % | |
|---|---|---|---|---|
| Republican | August Pfluger (incumbent) | 151,066 | 100.0 | |
| Total votes | 151,066 | 100.0 | ||
| Party | Candidate | Votes | % | ±% | |
|---|---|---|---|---|---|
| Republican | August Pfluger | 231,781 | 79.71 | −0.43 | |
| Democratic | Jon Hogg | 53,198 | 18.30 | −0.14 | |
| Libertarian | Wacey Cody | 5,784 | 1.99 | +0.56 | |
| Majority | 178,583 | 61.41 | −0.29 | ||
| Turnout | 290,763 | ||||
| Republican hold | Swing | ||||
| Party | Candidate | Votes | % | ±% | |
|---|---|---|---|---|---|
| Republican | Mike Conaway (incumbent) | 176,603 | 80.14 | −9.36 | |
| Democratic | Jennie Leeder | 40,631 | 18.44 | +18.44 | |
| Libertarian | Rhett Smith | 3,143 | 1.43 | −9.07 | |
| Majority | 135,972 | 61.70 | −17.30 | ||
| Turnout | 220,377 | ||||
| Republican hold | Swing | ||||
| Party | Candidate | Votes | % | ±% | |
|---|---|---|---|---|---|
| Republican | Mike Conaway (incumbent) | 201,871 | 89.50 | −0.77 | |
| Libertarian | Nicholas Landholt | 23,677 | 10.50 | +0.77 | |
| Majority | 178,194 | 79.00 | −1.54 | ||
| Turnout | 225,548 | ||||
| Republican hold | Swing | ||||
| Party | Candidate | Votes | % | ±% | |
|---|---|---|---|---|---|
| Republican | Mike Conaway (incumbent) | 107,939 | 90.27 | +11.63 | |
| Libertarian | Ryan Lange | 11,635 | 9.73 | +6.94 | |
| Majority | 96,304 | 80.54 | +20.47 | ||
| Turnout | 119,574 | ||||
| Republican hold | Swing | ||||
| Party | Candidate | Votes | % | ±% | |
|---|---|---|---|---|---|
| Republican | Mike Conaway (incumbent) | 177,742 | 78.64 | −2.20 | |
| Democratic | Jim Riley | 41,970 | 18.57 | +3.13 | |
| Libertarian | Scott Ballard | 6,311 | 2.79 | +0.01 | |
| Majority | 135,772 | 60.07 | −5.33 | ||
| Turnout | 226,023 | ||||
| Republican hold | Swing | ||||
| Party | Candidate | Votes | % | ±% | |
|---|---|---|---|---|---|
| Republican | Mike Conaway (incumbent) | 125,581 | 80.84 | −7.49 | |
| Democratic | James Quillian | 23,989 | 15.44 | +3.77 | |
| Libertarian | James Powell | 4,321 | 2.78 | +2.78 | |
| Green | Jim Howe | 1,449 | 0.93 | +0.93 | |
| Majority | 101,592 | 65.40 | −11.26 | ||
| Turnout | 155,340 | ||||
| Republican hold | Swing | ||||
| Party | Candidate | Votes | % | ±% | |
|---|---|---|---|---|---|
| Republican | Mike Conaway (incumbent) | 189,625 | 88.33 | −11.67 | |
| Libertarian | John Strohm | 25,051 | 11.67 | +11.67 | |
| Majority | 164,574 | 76.66 | −23.34 | ||
| Turnout | 214,676 | ||||
| Republican hold | Swing | ||||
| Party | Candidate | Votes | % | ±% | |
|---|---|---|---|---|---|
| Republican | Mike Conaway (incumbent) | 107,268 | 100.00 | +23.24 | |
| Majority | 107,268 | 100.00 | +45.03 | ||
| Turnout | 107,268 | ||||
| Republican hold | Swing | ||||
| Party | Candidate | Votes | % | ±% | |
|---|---|---|---|---|---|
| Republican | Mike Conaway | 177,291 | 76.8% | +29.7% | |
| Democratic | Wayne Raasch | 50,339 | 21.8% | −29.8% | |
| Libertarian | Jeffrey Blunt | 3,347 | 1.4% | +0.1% | |
| Majority | 126,952 | 55.0% | |||
| Turnout | 230,977 | ||||
| Republican gain from Democratic | Swing | +29.7% | |||
Historical district boundaries
[edit]

See also
[edit]References
[edit]- ^ "Congressional Districts Relationship Files (State-based)". U.S. Census Bureau. Archived from the original on April 2, 2013.
- ^ "My Congressional District".
- ^ "My Congressional District".
- ^ "2022 Cook PVI: District Map and List". Cook Political Report. Retrieved January 10, 2023.
- ^ Campbell, Bob (April 21, 2020). "Pfluger poised for Congress: GOP nominee sketches grassroots action". Odessa American. Archived from the original on April 22, 2020. Retrieved May 6, 2020.
- ^ https://www2.census.gov/geo/maps/cong_dist/cd118/cd_based/ST48/CD118_TX11.pdf
- ^ United States Congress. "LANHAM, Samuel Willis Tucker (id: L000078)". Biographical Directory of the United States Congress. Retrieved October 17, 2017.
- ^ "District Population Analysis with County Subtotals | CONGRESSIONAL DISTRICTS - PLANC2100" (PDF). Capitol Data Portal. Texas Legislative Council. August 26, 2021. Archived (PDF) from the original on June 27, 2022. Retrieved January 1, 2023.
- ^ "District Population Analysis with County Subtotals | CONGRESSIONAL DISTRICTS - PLANC2193" (PDF). Capitol Data Portal. Texas Legislative Council. October 17, 2021. Archived (PDF) from the original on December 25, 2022. Retrieved January 1, 2023.
- ^ https://davesredistricting.org/maps#viewmap::1c2c1e0d-2fd1-43a8-a039-73e7023124d1
- Martis, Kenneth C. (1989). The Historical Atlas of Political Parties in the United States Congress. New York: Macmillan Publishing Company.
- Martis, Kenneth C. (1982). The Historical Atlas of United States Congressional Districts. New York: Macmillan Publishing Company.
- Congressional Biographical Directory of the United States 1774–present