Phase portrait
| Differential equations |
|---|
| Scope |
| Classification |
| Solution |
| People |


In mathematics, a phase portrait is a geometric representation of the orbits of a dynamical system in the phase plane. Each set of initial conditions is represented by a different point or curve.
Phase portraits are an invaluable tool in studying dynamical systems. They consist of a plot of typical trajectories in the phase space. This reveals information such as whether an attractor, a repellor or limit cycle is present for the chosen parameter value. The concept of topological equivalence is important in classifying the behaviour of systems by specifying when two different phase portraits represent the same qualitative dynamic behavior. An attractor is a stable point which is also called a "sink". The repeller is considered as an unstable point, which is also known as a "source".
A phase portrait graph of a dynamical system depicts the system's trajectories (with arrows) and stable steady states (with dots) and unstable steady states (with circles) in a phase space. The axes are of state variables.
Examples
[edit]

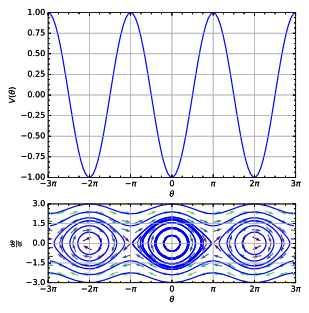
- Simple pendulum, see picture (right).
- Simple harmonic oscillator where the phase portrait is made up of ellipses centred at the origin, which is a fixed point.
- Damped harmonic motion, see animation (right).
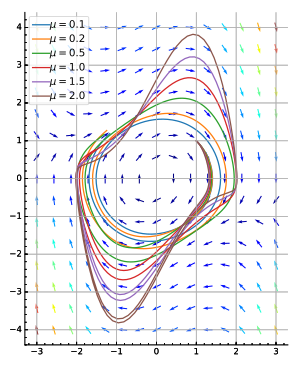
- Van der Pol oscillator see picture (bottom right).
Visualizing the behavior of ordinary differential equations
[edit]A phase portrait represents the directional behavior of a system of ordinary differential equations (ODEs). The phase portrait can indicate the stability of the system. [1]
| Unstable | Most of the system's solutions tend towards ∞ over time |
| Asymptotically stable | All of the system's solutions tend to 0 over time |
| Neutrally stable | None of the system's solutions tend towards ∞ over time, but most solutions do not tend towards 0 either |
The phase portrait behavior of a system of ODEs can be determined by the eigenvalues or the trace and determinant (trace = λ1 + λ2, determinant = λ1 x λ2) of the system.[1]
| Eigenvalue, Trace, Determinant | Phase Portrait Shape |
|---|---|
| λ1 & λ2 are real and of opposite sign;
Determinant < 0 |
Saddle (unstable) |
| λ1 & λ2 are real and of the same sign, and λ1 ≠ λ2;
0 < determinant < (trace2 / 4) |
Node (stable if trace < 0, unstable if trace > 0) |
| λ1 & λ2 have both a real and imaginary component;
(trace2 / 4) < determinant |
Spiral (stable if trace < 0, unstable if trace > 0) |
See also
[edit]References
[edit]- ^ a b c d Haynes Miller, and Arthur Mattuck. 18.03 Differential Equations. Spring 2010. Massachusetts Institute of Technology: MIT OpenCourseWare, https://ocw.mit.edu. License: Creative Commons BY-NC-SA. (Supplementary Notes 26 by Haynes Miller: https://ocw.mit.edu/courses/18-03-differential-equations-spring-2010/resources/mit18_03s10_chapter_26/)
- Jordan, D. W.; Smith, P. (2007). Nonlinear Ordinary Differential Equations (fourth ed.). Oxford University Press. ISBN 978-0-19-920824-1. Chapter 1.
- Steven Strogatz (2001). Non-linear Dynamics and Chaos: With applications to Physics, Biology, Chemistry and Engineering. ISBN 9780738204536.
External links
[edit]- Linear Phase Portraits, an MIT Mathlet.


