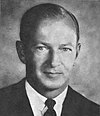
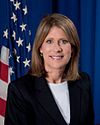
Kentucky's 3rd congressional district
| Kentucky's 3rd congressional district | |
|---|---|
Interactive map of district boundaries since January 3, 2023 | |
| Representative | |
| Distribution |
|
| Population (2023) | 733,409[2] |
| Median household income | $62,206[3] |
| Ethnicity |
|
| Cook PVI | D+9[4] |
Kentucky's 3rd congressional district is a congressional district in the U.S. state of Kentucky. It encompasses almost all of Louisville Metro, which, since the merger of 2003, is consolidated with Jefferson County, though other incorporated cities exist within the county, such as Shively and St. Matthews. The far eastern portions of Louisville Metro are part of the 2nd congressional district.
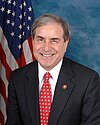
The district is currently represented by Democrat Morgan McGarvey. With a Cook Partisan Voting Index rating of D+9, it is the only Democratic district in Kentucky.[4]
Characteristics
[edit]The district's character is very different from the rest of Kentucky. It is entirely contained within Jefferson County, and in contrast to the rest of the state, it is urban and leans Democratic. It has the highest percentage of African Americans in the state, who are concentrated in and near Louisville. It is a cosmopolitan, diverse district, with major businesses, health care organizations and universities.
Until January 1, 2006, Kentucky did not track party affiliation for registered voters who were neither Democratic nor Republican.[5] The Kentucky voter registration card does not explicitly list anything other than Democratic Party, Republican Party, or Other, with the "Other" option having a blank line and no instructions on how to register as something else.[6]
| Year (Sept.) | Democratic | Republican | Other | Independent | Libertarian | Green | Constitution | Reform | Socialist Worker's | Male | Female | Registered | ||||||||||||
|---|---|---|---|---|---|---|---|---|---|---|---|---|---|---|---|---|---|---|---|---|---|---|---|---|
| Voters | % | Voters | % | Voters | % | Voters | % | Voters | % | Voters | % | Voters | % | Voters | % | Voters | % | Voters | % | Voters | % | Voters | % | |
| 2017 | 328,432 | 57.835 | 183,755 | 32.358 | 35,988 | 6.337 | 17,632 | 3.105 | 1,568 | 0.276 | 421 | 0.074 | 58 | 0.01 | 4 | 0.001 | 21 | 0.004 | 261,561 | 46.059 | 306,317 | 53.941 | 567,879 | 100 |
| 2018 | 335,172 | 57.984 | 185,426 | 32.078 | 36,011 | 6.23 | 19,204 | 3.322 | 1,724 | 0.298 | 397 | 0.069 | 63 | 0.011 | 7 | 0.001 | 40 | 0.007 | 266,355 | 46.079 | 311,688 | 53.921 | 578,044 | 100 |
| 2019 | 343,512 | 58.24 | 187,470 | 31.784 | 36,222 | 6.141 | 20,313 | 3.444 | 1,832 | 0.311 | 347 | 0.059 | 78 | 0.013 | 6 | 0.001 | 38 | 0.006 | 272,144 | 46.14 | 317,525 | 53.834 | 589,818 | 100 |
| 2020 | 354,146 | 58.045 | 194,002 | 31.797 | 34,855 | 5.713 | 24,185 | 3.964 | 2,317 | 0.38 | 408 | 0.067 | 116 | 0.019 | 24 | 0.004 | 73 | 0.012 | 282,897 | 46.367 | 326,906 | 53.58 | 610,126 | 100 |
| 2021 | 352,605 | 57.916 | 192,258 | 31.579 | 35,335 | 5.804 | 25,549 | 4.196 | 2,407 | 0.395 | 437 | 0.072 | 122 | 0.02 | 26 | 0.004 | 82 | 0.013 | 282,681 | 46.431 | 325,822 | 53.517 | 608,821 | 100 |
| 2022 | 100 | |||||||||||||||||||||||
Recent election results from statewide races
[edit]| Year | Office | Results[7][8][9] |
|---|---|---|
| 2008 | President | Obama 56% - 43% |
| 2012 | President | Obama 57% - 43% |
| 2016 | President | Clinton 55% - 40% |
| Senate | Gray 60% - 40% | |
| 2019 | Governor | Beshear 68% - 30% |
| Attorney General | Stumbo 61% - 39% | |
| 2020 | President | Biden 60% - 38% |
| Senate | McGrath 61% - 36% | |
| 2022 | Senate | Booker 60% - 40% |
| 2023 | Governor | Beshear 72% - 28% |
| Attorney General | Stevenson 63% - 37% |
Composition
[edit]| # | County | Seat | Population |
|---|---|---|---|
| 111 | Jefferson | Louisville | 772,114 |
Cities of 10,000 or more people
[edit]- Louisville – 624,444
- Jeffersontown – 28,474
- St. Matthews – 17,534
- Shively – 15,636
- Lyndon – 11,008
2,500 – 10,000 people
[edit]- Middletown – 9,706
- Douglass Hills – 5,456
- Hurstbourne – 4,683
- Prospect – 4,565
- Indian Hills – 2,860
- Graymoor-Devondale – 2,853
- Anchorage – 2,500
List of members representing the district
[edit]Election results
[edit]1930s
[edit]1932
[edit]| Party | Candidate | Votes | % | |
|---|---|---|---|---|
| Democratic | Fred M. Vinson (incumbent) | 575,191 | ||
| Democratic | John Y. Brown Sr. | 574,270 | ||
| Democratic | Andrew J. May (incumbent) | 574,189 | ||
| Democratic | Brent Spence (incumbent) | 574,079 | ||
| Democratic | Virgil Chapman (incumbent) | 573,750 | ||
| Democratic | Glover H. Cary (incumbent) | 573,505 | ||
| Democratic | William Voris Gregory (incumbent) | 573,269 | ||
| Democratic | Cap R. Carden (incumbent) | 573,257 | ||
| Democratic | Finley Hamilton | 573,024 | ||
| Republican | Hillard H. Smith | 391,868 | ||
| Republican | Robert E. Lee Blackburn | 391,674 | ||
| Republican | William Lewis | 390,982 | ||
| Republican | George P. Ellison | 390,739 | ||
| Republican | D.E. McClure | 390,474 | ||
| Republican | J.C. Speight | 390,370 | ||
| Republican | Hugh H. Asher | 390,148 | ||
| Republican | B.T. Rountree | 390,041 | ||
| Republican | Frank B. Russell | 389,950 | ||
| Socialist | John T. Scopes[10] | 3,273 | ||
| Socialist | J.J. Thobe | 3,264 | ||
| Socialist | C.E. Trimble | 3,260 | ||
| Socialist | W.G. Haag | 3,259 | ||
| Socialist | E. L. Nance | 3,256 | ||
| Socialist | E.C. Schulz | 3,256 | ||
| Socialist | J.M. Woodward | 3,255 | ||
| Socialist | H.L. Harwood | 3,254 | ||
| Socialist | D.S. Bennett | 3,252 | ||
| Communist | Frank Reynolds | 241 | ||
| Communist | George N. Conway | 236 | ||
| Total votes | ||||
| Turnout | ||||
| Democratic hold | ||||
1934
[edit]| Party | Candidate | Votes | % | |
|---|---|---|---|---|
| Democratic | Emmet O'Neal | 48,664 | 56.20 | |
| Republican | Frank M. Drake | 36,922 | 42.64 | |
| Independent | Peter J. Gnau | 414 | 0.48 | |
| Socialist | Clell G. Fowler | 395 | 0.46 | |
| Socialist Labor | William H. Brann | 165 | 0.19 | |
| Communist | J. Stuart McIntyre | 38 | 0.04 | |
| Total votes | 86,598 | 100.00 | ||
| Turnout | ||||
| Democratic hold | ||||
1936
[edit]| Party | Candidate | Votes | % | |
|---|---|---|---|---|
| Democratic | Emmet O'Neal (incumbent) | 85,034 | 60.30 | |
| Republican | W. A. Armstrong | 52,600 | 37.30 | |
| Union | Jerry V. Spencer | 3,206 | 2.27 | |
| Socialist | Sara Kasdan | 170 | 0.12 | |
| Total votes | 93,588 | 100.00 | ||
| Turnout | ||||
| Democratic hold | ||||
1938
[edit]| Party | Candidate | Votes | % | |
|---|---|---|---|---|
| Democratic | Emmet O'Neal (incumbent) | 57,227 | 61.15 | |
| Republican | Frank A. Ropke | 36,361 | 38.85 | |
| Total votes | 93,588 | 100.00 | ||
| Turnout | ||||
| Democratic hold | ||||
1940s
[edit]1940
[edit]| Party | Candidate | Votes | % | |
|---|---|---|---|---|
| Democratic | Emmet O'Neal (incumbent) | 96,253 | 60.00 | |
| Republican | Ben. J. Brumleve | 64,053 | 40.00 | |
| Total votes | 160,306 | 100.00 | ||
| Turnout | ||||
| Democratic hold | ||||
1942
[edit]| Party | Candidate | Votes | % | |
|---|---|---|---|---|
| Democratic | Emmet O'Neal (incumbent) | 39,866 | 55.16 | |
| Republican | Joett Ross Todd | 32,404 | 44.84 | |
| Total votes | 72,270 | 100.00 | ||
| Turnout | ||||
| Democratic hold | ||||
1944
[edit]| Party | Candidate | Votes | % | |||
|---|---|---|---|---|---|---|
| Republican | Garland R. Hubbard | 79,922 | 62.00 | |||
| Prohibition | Bessie Graham | 308 | 0.24 | |||
| Democratic | Frank L. Chelf | 48,671 | 37.76 | |||
| Total votes | 128,901 | 100.00 | ||||
| Turnout | ||||||
| Republican gain from Democratic | ||||||
1946
[edit]| Party | Candidate | Votes | % | |
|---|---|---|---|---|
| Republican | Thurston Ballard Morton | 61,899 | 58.12 | |
| Democratic | Emmet O'Neil | 44,599 | 41.88 | |
| Total votes | 106,498 | 100.00 | ||
| Turnout | ||||
| Republican hold | ||||
1948
[edit]| Party | Candidate | Votes | % | |
|---|---|---|---|---|
| Republican | Thruston Ballard Morton (incumbent) | 74,168 | 52.96 | |
| Democratic | Ralph H. Logan | 64,877 | 46.33 | |
| Progressive | Alfred M. Carroll | 686 | 0.49 | |
| Prohibition | Robert Jack Garrison | 315 | 0.22 | |
| Total votes | 140,046 | 100.00 | ||
| Turnout | ||||
| Republican hold | ||||
1950s
[edit]1950
[edit]| Party | Candidate | Votes | % | |
|---|---|---|---|---|
| Republican | Thruston Ballard Morton (incumbent) | 62,363 | 55.53 | |
| Democratic | Alex P. Humphrey | 49,935 | 44.47 | |
| Total votes | 112,298 | 100.00 | ||
| Turnout | ||||
| Republican hold | ||||
1952
[edit]| Party | Candidate | Votes | % | |
|---|---|---|---|---|
| Republican | John M Robsion, Jr | 95,041 | 54.01 | |
| Democratic | Boman L. Shamburger | 80,347 | 45.66 | |
| Independent | H. A. I. Rosenberg | 573 | 0.33 | |
| Total votes | 175,961 | 100.00 | ||
| Turnout | ||||
| Republican hold | ||||
1954
[edit]| Party | Candidate | Votes | % | |
|---|---|---|---|---|
| Republican | John M Robsion, Jr (incumbent) | 72,073 | 50.20 | |
| Democratic | Harrison M Robertson | 71,500 | 49.80 | |
| Total votes | 143,573 | 100.00 | ||
| Turnout | ||||
| Republican hold | ||||
1956
[edit]| Party | Candidate | Votes | % | |
|---|---|---|---|---|
| Democratic | Phillip Ardery | 84,912 | 43.21 | |
| Republican | John M Robsion, Jr (incumbent) | 111,598 | 56.79 | |
| Total votes | 196,510 | 100.00 | ||
| Turnout | ||||
| Republican hold | ||||
1958
[edit]| Party | Candidate | Votes | % | |||
|---|---|---|---|---|---|---|
| Democratic | Frank W Burke | 73,121 | 52.16 | |||
| Republican | John M Robsion (incumbent) | 67,059 | 47.84 | |||
| Total votes | 140,180 | 100.00 | ||||
| Turnout | ||||||
| Democratic gain from Republican | ||||||
1960s
[edit]1960
[edit]| Party | Candidate | Votes | % | |
|---|---|---|---|---|
| Democratic | Frank W. Burke (incumbent) | 115,421 | 50.25 | |
| Republican | Henry R. Heyburn | 114,263 | 49.75 | |
| Total votes | 229,684 | 100.00 | ||
| Turnout | ||||
| Democratic hold | ||||
1962
[edit]| Party | Candidate | Votes | % | |||
|---|---|---|---|---|---|---|
| Democratic | Frank W. Burke (incumbent) | 91,544 | 49.18 | |||
| Republican | M. G. "Gene" Snyder | 94,579 | 50.82 | |||
| Total votes | 229,684 | 100.00 | ||||
| Turnout | ||||||
| Republican gain from Democratic | ||||||
1964
[edit]| Party | Candidate | Votes | % | |||
|---|---|---|---|---|---|---|
| Democratic | Charles P. Farnsley | 117,892 | 53.82 | |||
| Republican | M.G. "Gene" Snyder (incumbent) | 101,168 | 46.18 | |||
| Total votes | 219,060 | 100.00 | ||||
| Turnout | ||||||
| Democratic gain from Republican | ||||||
1966
[edit]| Party | Candidate | Votes | % | |||
|---|---|---|---|---|---|---|
| Democratic | Norbert Blume | 46,240 | 40.99 | |||
| Republican | William O. Cowger | 66,577 | 59.01 | |||
| Total votes | 112,817 | 100.00 | ||||
| Turnout | ||||||
| Republican gain from Democratic | ||||||
1968
[edit]| Party | Candidate | Votes | % | |
|---|---|---|---|---|
| Republican | William O. Cowger (incumbent) | 70,318 | 55.95 | |
| Democratic | Tom Ray | 55,366 | 44.05 | |
| Total votes | 125,684 | 100.00 | ||
| Turnout | ||||
| Republican hold | ||||
1970s
[edit]1970
[edit]| Party | Candidate | Votes | % | |||
|---|---|---|---|---|---|---|
| Republican | William O. Cowger (incumbent) | 49,891 | 48.32 | |||
| Democratic | Romano L. Mazzoli | 50,102 | 48.52 | |||
| American | Ronald W. Watson | 3,265 | 3.16 | |||
| Total votes | 103,258 | 100.00 | ||||
| Turnout | ||||||
| Democratic gain from Republican | ||||||
1972
[edit]| Party | Candidate | Votes | % | |
|---|---|---|---|---|
| Democratic | Romano L. Mazzoli (incumbent) | 86,810 | 62.15 | |
| Republican | Phil Kaelin, Jr | 51,634 | 36.97 | |
| American | William P. Chambers | 1,227 | 0.88 | |
| Total votes | 139,671 | 100.00 | ||
| Turnout | ||||
| Democratic hold | ||||
1974
[edit]| Party | Candidate | Votes | % | |
|---|---|---|---|---|
| Republican | Vincent N. Barclay | 28,813 | 26.56 | |
| Democratic | Romano L. Mazzoli (incumbent) | 37,346 | 69.67 | |
| American | William P. Chambers | 3,383 | 3.12 | |
| Independent | Luther J. Wilson | 708 | 0.65 | |
| Total votes | 108,475 | 100.00 | ||
| Turnout | ||||
| Democratic hold | ||||
1976
[edit]| Party | Candidate | Votes | % | |
|---|---|---|---|---|
| Republican | Denzil J. Ramsey | 58,019 | 41.22 | |
| Democratic | Romano L. Mazzoli (incumbent) | 80,496 | 57.19 | |
| American | William P. Chambers | 2,229 | 1.58 | |
| Total votes | 140,744 | 100.00 | ||
| Turnout | ||||
| Democratic hold | ||||
1978
[edit]| Party | Candidate | Votes | % | |
|---|---|---|---|---|
| Democratic | Romano L. Mazzoli (incumbent) | 37,346 | 65.67 | |
| Republican | Norbert D. Leveronne | 17,785 | 31.27 | |
| Independent | Tom Beckham | 1,312 | 2.31 | |
| Socialist Workers | John Cumbler | 428 | 0.75 | |
| Total votes | 56,871 | 100.00 | ||
| Turnout | ||||
| Democratic hold | ||||
1980s
[edit]1980
[edit]| Party | Candidate | Votes | % | |
|---|---|---|---|---|
| Democratic | Romano L. Mazzoli (incumbent) | 85,873 | 63.74 | |
| Republican | Richard Cesler | 46,681 | 34.65 | |
| American | Robert D. Vessels | 468 | 0.35 | |
| Citizens | John Cumbler | 1,272 | 0.94 | |
| Libertarian | Henry G. Logsdon | 430 | 0.32 | |
| Total votes | 134,724 | 100.00 | ||
| Turnout | ||||
| Democratic hold | ||||
1982
[edit]| Party | Candidate | Votes | % | |
|---|---|---|---|---|
| Republican | Carl Brown | 45,900 | 32.19 | |
| Democratic | Romano L. Mazzoli (incumbent) | 92,849 | 65.11 | |
| Independent | Norbert D. Leveronne | 2,840 | 1.99 | |
| Libertarian | Dan Murray | 608 | 0.43 | |
| Socialist Workers | Craig Honts | 400 | 0.28 | |
| Total votes | 142,597 | 100.00 | ||
| Turnout | ||||
| Democratic hold | ||||
1984
[edit]| Party | Candidate | Votes | % | |
|---|---|---|---|---|
| Republican | Suzanne M. Warner | 68,185 | 31.67 | |
| Democratic | Romano L. Mazzoli (incumbent) | 145,680 | 67.67 | |
| Independent | Peggy Kreiner | 1,273 | 0.59 | |
| Write-In | 139 | 0.06 | ||
| Total votes | 215,277 | 100.00 | ||
| Turnout | ||||
| Democratic hold | ||||
1986
[edit]| Party | Candidate | Votes | % | |
|---|---|---|---|---|
| Republican | Lee Holmes | 29,348 | 26.15 | |
| Democratic | Romano L. Mazzoli (incumbent) | 81,943 | 73.01 | |
| Socialist Workers | Estelle Debates | 899 | 0.80 | |
| Write-In | 43 | 0.04 | ||
| Total votes | 112,233 | 100.00 | ||
| Turnout | ||||
| Democratic hold | ||||
1988
[edit]| Party | Candidate | Votes | % | |
|---|---|---|---|---|
| Republican | Philip Dunnagan | 57,387 | 30.30 | |
| Democratic | Romano L. Mazzoli (incumbent) | 131,981 | 69.70 | |
| Total votes | 189,368 | 100.00 | ||
| Turnout | ||||
| Democratic hold | ||||
1990s
[edit]1990
[edit]| Party | Candidate | Votes | % | |
|---|---|---|---|---|
| Republican | Al Brown | 55,188 | 39.44 | |
| Democratic | Romano L. Mazzoli | 84,750 | 60.56 | |
| Total votes | 139,938 | 100.00 | ||
| Turnout | ||||
| Democratic hold | ||||
1992
[edit]| Party | Candidate | Votes | % | |
|---|---|---|---|---|
| Democratic | Romano L. Mazzoli (incumbent) | 148,066 | 52.74 | |
| Republican | Susan B. Stokes | 132,689 | 47.26 | |
| Write-In | Patricia Metten | 15 | 0.005 | |
| Total votes | 280,770 | 100.00 | ||
| Turnout | ||||
| Democratic hold | ||||
1994
[edit]| Party | Candidate | Votes | % | |
|---|---|---|---|---|
| Democratic | Mike Ward | 67,663 | 44.36 | |
| Republican | Susan B. Stokes | 67,238 | 44.08 | |
| U.S. Taxpayers' Party (United States) | Richard Lewis | 17,591 | 11.53 | |
| Write-In | Valerie Cohen | 31 | 0.02 | |
| Total votes | 152,523 | 100.00 | ||
| Turnout | ||||
| Democratic hold | ||||
1996
[edit]| Party | Candidate | Votes | % | |||
|---|---|---|---|---|---|---|
| Republican | Anne Northup | 126,625 | 50.26 | |||
| Democratic | Mike Ward (Incumbent) | 125,326 | 49.74 | |||
| Total votes | 251,951 | 100.00 | ||||
| Turnout | ||||||
| Republican gain from Democratic | ||||||
1998
[edit]| Party | Candidate | Votes | % | |
|---|---|---|---|---|
| Republican | Anne Northup (Incumbent) | 100,690 | 52.02 | |
| Democratic | Chris Gorman | 92,865 | 47.98 | |
| Total votes | 193,555 | 100.00 | ||
| Turnout | ||||
| Republican hold | ||||
2000s
[edit]2000
[edit]| Party | Candidate | Votes | % | |
|---|---|---|---|---|
| Republican | Anne Northup (Incumbent) | 142,106 | 52.87 | |
| Democratic | Eleanor Jordon | 118,875 | 44.23 | |
| Libertarian | Donna Walker Mancini | 7,804 | 2.90 | |
| Total votes | 268,785 | 100.00 | ||
| Turnout | 67.9 | |||
| Republican hold | ||||
2002
[edit]| Party | Candidate | Votes | % | |
|---|---|---|---|---|
| Republican | Anne Northup (Incumbent) | 118,228 | 51.61 | |
| Democratic | Jack Conway | 110,846 | 48.39 | |
| Total votes | 229,074 | 100.00 | ||
| Turnout | ||||
| Republican hold | ||||
2004
[edit]| Party | Candidate | Votes | % | |
|---|---|---|---|---|
| Republican | Anne Northup (Incumbent) | 197,736 | 60.26 | |
| Democratic | Tony Miller | 124,040 | 37.80 | |
| Libertarian | George C. Dick | 6,363 | 1.94 | |
| Total votes | 328,139 | 100.00 | ||
| Turnout | ||||
| Republican hold | ||||
2006
[edit]| Party | Candidate | Votes | % | |||
|---|---|---|---|---|---|---|
| Democratic | John Yarmuth | 122,471 | 50.62 | |||
| Republican | Anne Northup (Incumbent) | 116,555 | 48.18 | |||
| Libertarian | Donna Walker Mancini | 2,134 | 0.88 | |||
| Constitution | W. Ed Parker | 774 | 0.32 | |||
| Total votes | 241,934 | 100.00 | ||||
| Turnout | ||||||
| Democratic gain from Republican | ||||||
2008
[edit]| Party | Candidate | Votes | % | |
|---|---|---|---|---|
| Democratic | John Yarmuth (Incumbent) | 203,843 | 59.37 | |
| Republican | Anne Northup | 139,527 | 40.64 | |
| Libertarian | Ed Martin | Republican sued; votes not counted | 0.00 | |
| Total votes | 343,370 | 100.00 | ||
| Turnout | ||||
| Democratic hold | ||||
2010s
[edit]2010
[edit]| Party | Candidate | Votes | % | |
|---|---|---|---|---|
| Democratic | John Yarmuth (Incumbent) | 139,940 | 54.68 | |
| Republican | Todd Lally | 112,627 | 44.01 | |
| Libertarian | Ed Martin | 2,029 | 0.79 | |
| Independent | Michael Hansen | 1,334 | 0.52 | |
| Total votes | 255,930 | 100.00 | ||
| Turnout | ||||
| Democratic hold | ||||
2012
[edit]| Party | Candidate | Votes | % | |
|---|---|---|---|---|
| Democratic | John Yarmuth (Incumbent) | 206,385 | 63.96 | |
| Republican | Brooks Wicker | 111,452 | 34.54 | |
| Independent | Robert L. DeVore, Jr. | 4.819 | 1.49 | |
| Total votes | 322,656 | 100.0 | ||
| Turnout | ||||
| Democratic hold | ||||
2014
[edit]| Party | Candidate | Votes | % | |
|---|---|---|---|---|
| Democratic | John Yarmuth (Incumbent) | 157,056 | 63.5 | |
| Republican | Michael MacFarlane | 87,981 | 35.6 | |
| Independent | Gregory Peter Puccetti | 2,318 | 0.9 | |
| Total votes | 247,355 | 100 | ||
| Democratic hold | ||||
2016
[edit]| Party | Candidate | Votes | % | |
|---|---|---|---|---|
| Democratic | John Yarmuth (Incumbent) | 212,401 | 63.5 | |
| Republican | Harold Bratcher | 122,093 | 36.5 | |
| Total votes | 334,494 | 100.00 | ||
| Democratic hold | ||||
2018
[edit]| Party | Candidate | Votes | % | |
|---|---|---|---|---|
| Democratic | John Yarmuth (Incumbent) | 173,002 | 62.1 | |
| Republican | Vickie Yates Glisson | 101,930 | 36.6 | |
| Libertarian | Gregory Boles | 3,788 | 1.4 | |
| Total votes | 278,720 | 100.00 | ||
| Democratic hold | ||||
2020s
[edit]2020
[edit]| Party | Candidate | Votes | % | |
|---|---|---|---|---|
| Democratic | John Yarmuth (Incumbent) | 230,672 | 62.7 | |
| Republican | Rhonda Palazzo | 137,425 | 37.3 | |
| Total votes | 368,097 | 100.00 | ||
| Democratic hold | ||||
2022
[edit]| Party | Candidate | Votes | % | |
|---|---|---|---|---|
| Democratic | Morgan McGarvey | 160,920 | 61.9 | |
| Republican | Stuart Ray | 98,637 | 38.0 | |
| Daniel Cobble (write-in) | 30 | 0.01% | ||
| Total votes | 259,587 | 100.00 | ||
| Democratic hold | ||||
Historical district maps
[edit]| Year | District 3 | All Districts |
|---|---|---|
| 1935–1943 | 
|

|
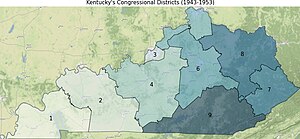
| 1943–1953 | 
|
|
| 1953–1943 | 
|

|
| 1963–1973 | 
|

|
| 1973–1983 | 
|

|
| 1983–1993 | 
|

|
| 1993–2003 | 
|

|
| 2003–2013 | 
|

|
| 2013–2023 | 
|

|
See also
[edit]References
[edit]- Specific
- ^ "Congressional Districts Relationship Files (state-based". census.gov. US Census Bureau Geography. Archived from the original on July 17, 2017. Retrieved February 11, 2018.
- ^ "My Congressional District". census.gov. Center for New Media & Promotion (CNMP), US Census Bureau. Archived from the original on June 30, 2021. Retrieved September 22, 2024.
- ^ "My Congressional District Bureau". census.gov. Center for New Media & Promotion (CNMP), US Census Bureau. Archived from the original on June 30, 2021. Retrieved September 22, 2024.
- ^ a b "2022 Cook PVI: District Map and List". Cook Political Report. July 12, 2022. Archived from the original on December 27, 2022. Retrieved January 10, 2023.
- ^ "Kentucky Administrative Regulations 31KAR4:150". Kentucky Legislative Research Commission. November 2005. Archived from the original on September 11, 2016. Retrieved February 6, 2014.
- ^ "Register To Vote". Kentucky State Board of Elections. August 2003. Archived from the original on February 2, 2014. Retrieved February 6, 2014.
- ^ https://davesredistricting.org/maps#viewmap::0ec1616e-7ed6-4f84-b20d-dcc51221b2bf
- ^ Kentucky Senate Results by CD. docs.google.com (Report).
- ^ https://lookerstudio.google.com/reporting/75e97d20-411d-4954-9f27-8cc57a80aa96/page/p_zagwlwambd
- ^ "August 12, 1932 (Page 1 of 24)." The Courier-Journal (1923–2001), August 12, 1932, pp. 1.
- ^ "Election Statistics: 1920 to Present". history.house.gov. Archived from the original on November 21, 2020. Retrieved May 10, 2024.
- ^ "General Elections Results" (PDF). Kentucky Secretary of State. November 4, 2014. Archived (PDF) from the original on March 7, 2017. Retrieved December 19, 2014.
- General
- Martis, Kenneth C. (1989). The Historical Atlas of Political Parties in the United States Congress. New York: Macmillan Publishing Company.
- Martis, Kenneth C. (1982). The Historical Atlas of United States Congressional Districts. New York: Macmillan Publishing Company.
- Congressional Biographical Directory of the United States 1774–present
External links
[edit] Media related to Kentucky's 3rd congressional district at Wikimedia Commons
- Congressional districts of Kentucky
- Government of Louisville, Kentucky
- Jefferson County, Kentucky
- Constituencies established in 1803
- 1803 establishments in Kentucky
- Constituencies disestablished in 1933
- 1933 disestablishments in Kentucky
- Constituencies established in 1935
- 1935 establishments in Kentucky
- Richard Mentor Johnson


