Ibirubá
Appearance

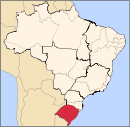
Ibirubá is a municipality in the state of Rio Grande do Sul, Brazil. As of 2020, the estimated population was 20,413.[1]
Geography
[edit]Climate
[edit]| Climate data for Ibirubá (1981–2010) | |||||||||||||
|---|---|---|---|---|---|---|---|---|---|---|---|---|---|
| Month | Jan | Feb | Mar | Apr | May | Jun | Jul | Aug | Sep | Oct | Nov | Dec | Year |
| Mean daily maximum °C (°F) | 30.1 (86.2) |
28.9 (84.0) |
28.4 (83.1) |
25.8 (78.4) |
21.5 (70.7) |
19.5 (67.1) |
19.0 (66.2) |
21.2 (70.2) |
22.1 (71.8) |
25.3 (77.5) |
28.1 (82.6) |
30.0 (86.0) |
25.0 (77.0) |
| Daily mean °C (°F) | 23.5 (74.3) |
22.6 (72.7) |
21.6 (70.9) |
18.9 (66.0) |
15.3 (59.5) |
13.7 (56.7) |
13.0 (55.4) |
14.8 (58.6) |
15.7 (60.3) |
18.7 (65.7) |
21.2 (70.2) |
23.1 (73.6) |
18.5 (65.3) |
| Mean daily minimum °C (°F) | 18.0 (64.4) |
17.4 (63.3) |
16.1 (61.0) |
13.3 (55.9) |
10.4 (50.7) |
9.0 (48.2) |
8.2 (46.8) |
9.6 (49.3) |
10.5 (50.9) |
13.0 (55.4) |
15.1 (59.2) |
17.0 (62.6) |
13.1 (55.6) |
| Average precipitation mm (inches) | 152.8 (6.02) |
162.4 (6.39) |
112.1 (4.41) |
155.8 (6.13) |
116.7 (4.59) |
127.6 (5.02) |
166.1 (6.54) |
144.6 (5.69) |
166.7 (6.56) |
219.3 (8.63) |
153.6 (6.05) |
132.4 (5.21) |
1,810.1 (71.26) |
| Average precipitation days (≥ 1.0 mm) | 10 | 10 | 8 | 8 | 7 | 8 | 9 | 8 | 9 | 10 | 8 | 8 | 103 |
| Average relative humidity (%) | 74.1 | 78.4 | 77.0 | 76.5 | 80.3 | 82.8 | 82.0 | 78.7 | 77.9 | 76.0 | 69.5 | 69.4 | 76.9 |
| Source: Instituto Nacional de Meteorologia[2] | |||||||||||||
See also
[edit]28°38′S 53°06′W / 28.633°S 53.100°W
References
[edit]- ^ IBGE 2020
- ^ "Normais Climatológicas Do Brasil 1981–2010" (in Portuguese). Instituto Nacional de Meteorologia. Retrieved 21 May 2024.


