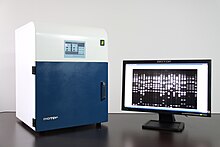
Gel doc
This article needs additional citations for verification. (November 2017) |

A gel doc, also known as a gel documentation system, gel image system or gel imager, refers to equipment widely used in molecular biology laboratories for the imaging and documentation of nucleic acid and protein suspended within polyacrylamide or agarose gels.[1][2] Genetic information is stored in DNA. Polyacrylamide or agarose gel electrophoresis procedures are carried out to examine nucleic acids or proteins in order to analyze the genetic data.[3] For protein analysis, two-dimensional gel electrophoresis is employed (2-DGE) which is one of the methods most frequently used in comparative proteomic investigations that can distinguish thousands of proteins in a single run. Proteins are separated using 2-DGE first, based on their isoelectric points (pIs) in one dimension and then based on their molecular mass in the other. After that, a thorough qualitative and quantitative analysis of the proteomes is performed using gel documentation with software image assessment methods on the 2-DGE gels stained for protein visibility.[4] Gels are typically stained with Ethidium bromide[5] or other nucleic acid stains such as GelGreen.
Generally, a gel doc includes an ultraviolet (UV) light transilluminator, a hood or a darkroom to shield external light sources and protect the user from UV exposure, a computer, software and a high-performance CCD camera for image capturing. Regarding the optical sensor utilized in commercial gel-document systems, the image quality increases with image sensor size. With advancement in CMOS camera sensors like Sony's Pregius and Exmor series, low light capable cameras made of these sensors are also being incorporated in gel documentation systems. The dynamic range of the imaging device is a significant barrier to detecting the complete concentration range of cellular proteins in 2DE gels. Dense protein regions are extremely luminous and require just brief exposures in fluorescence imagers with full-field illumination and CCD cameras. Longer exposures are needed for protein sites with low density. High-abundance proteins are frequently found beside low-abundance proteins on 2DE gels. Because of the fluorescent signals produced by high-abundance proteins, long exposure durations needed to detect low-abundance proteins frequently result in pixel saturation. Avoiding this detector saturation limit is crucial for getting high dynamic range gel images since the measurement of protein regions relies on correct intensity values for all pixels inside a gel image.[6]
The main manufacturers of gel documentation systems are MaestroGen, Cytiva, Bio Rad, Azure Biosystems, Bioolympics, Syngene, Vilber Lourmat, UVItec, UVP, Biozen, Imagene and Aplegen. Recently affordable systems from Chinese manufacturers like Clinx and Indian manufacturers like iGene Labserve , Biozen Labs have entered the market.
For certain extremely low light applications like chemiluminescence(CL), gel documentation systems are also being designed with cooled cameras that enable longer exposures without the sensor heating up. These ChemiDoc technology systems are broadly used to detect wide range of analytes with high- throughput screening due to its sensitivity, efficiency, low noise.[7] Verifying the loading, quality, and separation can be detect on the ChemiDoc MP (Bio-Rad) camera system.[8] In the stain-free gel imaging procedure, tryptophan residues undergo a UV-induced interaction with trihalo chemicals in the stain-free gel to produce a fluorescence signal. Utilizing the Bio-Rad ChemiDoc MP Imaging System, activate the gel by UV transillumination for 1 min. Using the stain-free gel setting and automatically optimized exposure duration setting, photographing the gel can be done. Manually shorten the exposure duration if the gel has been overexposed.[9] It produces images of faint bands and spots in gels and blots that would otherwise not have been visible to the naked eye. The resulting images show wide, glowing regions for proteins with high abundance, and small, dim spots for proteins with low abundance.
Models also include features to handle a variety of fluorescence and chemiluminescence with cameras cooled to -28 to -60 °C. Other advanced features include instant printing on-board the camera and Wi-Fi connectivity for control by smartphone and tablet devices.
References
[edit]- ^ Lee PY, Costumbrado J, Hsu CY, Kim YH (April 2012). "Agarose gel electrophoresis for the separation of DNA fragments". Journal of Visualized Experiments. 62 (62): 3923. doi:10.3791/3923. PMC 4846332. PMID 22546956.
- ^ Chew FN, Tan WS, Ling TC, Tan CS, Tey BT (January 2009). "Quantitation of green fluorescent protein using a gel-based imaging method" (PDF). Analytical Biochemistry. 384 (2): 353–355. doi:10.1016/j.ab.2008.10.010. PMID 18952038.
- ^ Baek JY, Kim JD, Kim YS, Park CY, Hwang JS (October 2021). "Open Platform Cameras Based Bio-Imaging Evaluation System". Sensors. 21 (20): 6727. Bibcode:2021Senso..21.6727B. doi:10.3390/s21206727. PMC 8541520. PMID 34695940.
- ^ Goez, Manuel Mauricio; Torres-Madroñero, Maria Constanza; Röthlisberger, Sarah; Delgado-Trejos, Edilson (February 2018). "Preprocessing of 2-Dimensional Gel Electrophoresis Images Applied to Proteomic Analysis: A Review". Genomics, Proteomics & Bioinformatics. 16 (1): 63–72. doi:10.1016/j.gpb.2017.10.001. PMC 6000252. PMID 29474888.
- ^ Gonzalez AG, González-García M, Pérez-Ballestero R (November 2022). "Low-cost modular systems for agarose gel documentation". BioTechniques. 73 (5): 227–232. doi:10.2144/btn-2022-0060. PMID 36318177. S2CID 253245906.
- ^ Van PT, Bass V, Shiwarski D, Lanni F, Minden J (September 2014). "High dynamic range proteome imaging with the structured illumination gel imager". Electrophoresis. 35 (18): 2642–2655. doi:10.1002/elps.201400126. PMID 24935033. S2CID 37749989.
- ^ Yan Y, Shi P, Song W, Bi S (2019). "Chemiluminescence and Bioluminescence Imaging for Biosensing and Therapy: In Vitro and In Vivo Perspectives". Theranostics. 9 (14): 4047–4065. doi:10.7150/thno.33228. PMC 6592176. PMID 31281531. S2CID 189805482.
- ^ Taylor SC, Posch A (2014). "The design of a quantitative western blot experiment". BioMed Research International. 2014: 361590. doi:10.1155/2014/361590. PMC 3971489. PMID 24738055.
- ^ Gilda JE, Gomes AV (2015). "Western blotting using in-gel protein labeling as a normalization control: stain-free technology". Proteomic Profiling. Methods in Molecular Biology. Vol. 1295. pp. 381–391. doi:10.1007/978-1-4939-2550-6_27. ISBN 978-1-4939-2549-0. PMID 25820735.
