
File:LiverMRE wiki final.tif

Size of this JPG preview of this TIF file: 800 × 568 pixels. Other resolutions: 320 × 227 pixels | 640 × 455 pixels | 980 × 696 pixels.
Original file (980 × 696 pixels, file size: 1.98 MB, MIME type: image/tiff)
| This is a file from the Wikimedia Commons. Information from its description page there is shown below. Commons is a freely licensed media file repository. You can help. |
Summary
| Description |
English: MR elastography for detection of liver fibrosis in two patients. The left column shows the anatomy, with the liver outlined. The middle row shows images of propagating shear waves in the liver, captured with the MRE technique. The right column shows elastograms computed from the wave images, with tissue stiffness depicted with on color scale. In the top row, the mean liver stiffness is 1.8 kPa, in the normal range. In the lower row, the patient has a mean liver stiffness of 5.7 kPa, indicating the presence of advanced liver fibrosis (cirrhosis). |
| Date | |
| Source | Own work |
| Author | MRelasto |
Licensing
I, the copyright holder of this work, hereby publish it under the following license:
This file is licensed under the Creative Commons Attribution-Share Alike 4.0 International license.
- You are free:
- to share – to copy, distribute and transmit the work
- to remix – to adapt the work
- Under the following conditions:
- attribution – You must give appropriate credit, provide a link to the license, and indicate if changes were made. You may do so in any reasonable manner, but not in any way that suggests the licensor endorses you or your use.
- share alike – If you remix, transform, or build upon the material, you must distribute your contributions under the same or compatible license as the original.

|
This media file is uncategorized.
Please help improve this media file by adding it to one or more categories, so it may be associated with related media files (how?), and so that it can be more easily found.
Please notify the uploader with {{subst:Please link images|File:LiverMRE wiki final.tif}} ~~~~ |
File history
Click on a date/time to view the file as it appeared at that time.
| Date/Time | Thumbnail | Dimensions | User | Comment | |
|---|---|---|---|---|---|
| current | 19:57, 21 February 2023 | 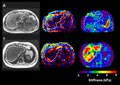 | 980 × 696 (1.98 MB) | MRelasto | Uploaded while editing "Magnetic resonance elastography" on wiki.riteme.site |
File usage
The following page uses this file:
Global file usage
The following other wikis use this file:
- Usage on uz.wikipedia.org