Electoral history of George H. W. Bush
Appearance

| ||
|---|---|---|
|
Personal 43rd Vice President of the United States Vice presidential campaigns 41st President of the United States Tenure Policies Appointments Presidential campaigns  |
||
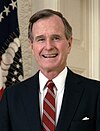
George Herbert Walker Bush served as the 41st president of the United States (1989–1993), the 43rd vice president (1981–1989), the 11th director of central intelligence (1976–1977), and as a United States representative from Texas (1967–1971).
Congressional elections (1964–1970)
[edit]1964
[edit]| Party | Candidate | Votes | % | |
|---|---|---|---|---|
| Republican | George H. W. Bush | 62,985 | 44.08% | |
| Republican | Jack Cox | 45,561 | 31.89% | |
| Republican | Robert J. Morris | 28,279 | 19.79% | |
| Republican | Milton Davis | 6,067 | 4.25% | |
| Total votes | 142,892 | 100.00% | ||
| Party | Candidate | Votes | % | |
|---|---|---|---|---|
| Republican | George H. W. Bush | 49,751 | 62.12% | |
| Republican | Jack Cox | 30,333 | 37.88% | |
| Total votes | 80,084 | 100.00% | ||
| Party | Candidate | Votes | % | |
|---|---|---|---|---|
| Democratic | Ralph Yarborough (incumbent) | 1,463,958 | 56.22% | |
| Republican | George H. W. Bush | 1,134,337 | 43.56% | |
| Constitution | Jack Carswell | 5,542 | 0.21% | |
| Total votes | 2,603,837 | 100.00% | ||
1966
[edit]| Party | Candidate | Votes | % | |
|---|---|---|---|---|
| Republican | George H. W. Bush | 53,756 | 57.07% | |
| Democratic | Frank Briscoe | 39,958 | 42.42% | |
| Constitution | Bob Gray | 488 | 0.52% | |
| Total votes | 94,202 | 100.00% | ||
1968
[edit]| Party | Candidate | Votes | % | |
|---|---|---|---|---|
| Republican | George H. W. Bush (incumbent) | 110,455 | 100.00% | |
| Total votes | 110,455 | 100.00% | ||
1970
[edit]| Party | Candidate | Votes | % | |
|---|---|---|---|---|
| Republican | George H. W. Bush | 96,806 | 87.64% | |
| Republican | Robert J. Morris | 13,654 | 12.36% | |
| Total votes | 110,460 | 100.00% | ||
| Party | Candidate | Votes | % | |
|---|---|---|---|---|
| Democratic | Lloyd Bentsen | 1,194,069 | 53.55% | |
| Republican | George H. W. Bush | 1,035,794 | 46.45% | |
| Total votes | 2,229,863 | 100.00% | ||
Presidential elections (1980–1992)
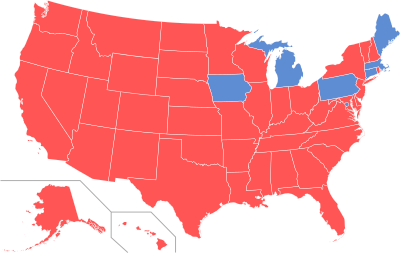
[edit]1980
[edit]
| Party | Candidate | Votes | % | |
|---|---|---|---|---|
| Republican | Ronald Reagan | 7,709,793 | 59.79% | |
| Republican | George H. W. Bush | 3,070,033 | 23.81% | |
| Republican | John B. Anderson | 1,572,174 | 12.19% | |
| Republican | Howard Baker | 181,153 | 1.41% | |
| Republican | Phil Crane | 97,793 | 0.76% | |
| Republican | John Connally | 82,625 | 0.64% | |
| Republican | Uncommitted | 68,155 | 0.53% | |
| Republican | Ben Fernandez | 25,520 | 0.20% | |
| Republican | Harold Stassen | 25,425 | 0.20% | |
| Republican | Gerald Ford | 10,557 | 0.08% | |
| Republican | Bob Dole | 7,204 | 0.06% | |
| Republican | Others | 33,217 | 0.26% | |
| Total votes | 12,883,649 | 100.00% | ||
| Party | Candidate | Votes | % | |
|---|---|---|---|---|
| Republican | Ronald Reagan | 1,939 | 97.44% | |
| Republican | John B. Anderson | 37 | 1.86% | |
| Republican | George H. W. Bush | 13 | 0.65% | |
| Republican | Anne Armstrong | 1 | 0.05% | |
| Total votes | 1,990 | 100.00% | ||
| Party | Candidate | Votes | % | |
|---|---|---|---|---|
| Republican | George H. W. Bush | 1,832 | 93.33% | |
| Republican | Jesse Helms | 54 | 2.75% | |
| Republican | Jack Kemp | 42 | 2.14% | |
| Republican | Phil Crane | 23 | 1.17% | |
| Republican | James R. Thompson | 5 | 0.26% | |
| Republican | John M. Ashbrook | 1 | 0.05% | |
| Republican | Howard Baker | 1 | 0.05% | |
| Republican | Henry J. Hyde | 1 | 0.05% | |
| Republican | Donald Rumsfeld | 1 | 0.05% | |
| Republican | Eugene Schroeder | 1 | 0.05% | |
| Republican | William E. Simon | 1 | 0.05% | |
| Republican | Guy Vander Jagt | 1 | 0.05% | |
| Total votes | 1,963 | 100.00% | ||

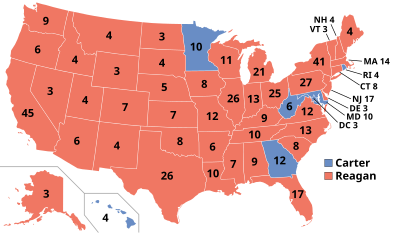
Reagan: 489 votes (44 states)
Carter: 49 votes (6 states + DC)
| Party | Candidate | Votes | % | |
|---|---|---|---|---|
| Republican | Ronald Reagan / George H. W. Bush | 43,903,230 | 50.75% | |
| Democratic | Jimmy Carter / Walter Mondale (incumbent) | 35,480,115 | 41.01% | |
| Independent | John B. Anderson / Patrick Joseph Lucey | 5,719,850 | 6.61% | |
| Libertarian | Ed Clark / David H. Koch | 921,128 | 1.06% | |
| Citizens | Barry Commoner / LaDonna Harris | 233,052 | 0.27% | |
| Communist | Gus Hall / Angela Davis | 44,933 | 0.05% | |
| American Independent | John Rarick / Eileen Shearer | 40,906 | 0.05% | |
| N/A | Others | 166,464 | 0.19% | |
| Total votes | 86,509,678 | 100.00% | ||
1984
[edit]| Party | Candidate | Votes | % | |
|---|---|---|---|---|
| Republican | George H. W. Bush (incumbent) | 2,231 | 99.82% | |
| Republican | (abstention) | 2 | 0.09% | |
| Republican | Jack Kemp | 1 | 0.05% | |
| Republican | Jeane Kirkpatrick | 1 | 0.05% | |
| Total votes | 2,235 | 100.00% | ||

Reagan: 525 votes (49 states)
Mondale: 13 votes (1 state + DC)
| Party | Candidate | Votes | % | |
|---|---|---|---|---|
| Republican | Ronald Reagan (incumbent) / George H. W. Bush (incumbent) | 54,455,472 | 58.77% | |
| Democratic | Walter Mondale / Geraldine Ferraro | 37,577,352 | 40.56% | |
| Libertarian | David Bergland / Jim Lewis | 228,111 | 0.25% | |
| Independent | Lyndon LaRouche / Billy Davis | 78,809 | 0.09% | |
| Citizens | Sonia Johnson / Richard Walton | 72,161 | 0.08% | |
| Populist | Bob Richards / Maureen Salaman | 66,324 | 0.07% | |
| New Alliance | Dennis L. Serrette / Nancy Ross | 46,853 | 0.05% | |
| Workers World | Larry Holmes / Gloria La Riva | 46,853 | 0.05% | |
| N/A | Others | 112,266 | 0.12% | |
| Total votes | 92,653,233 | 100.00% | ||
1988
[edit]| Party | Candidate | Votes | % | |
|---|---|---|---|---|
| Republican | George H. W. Bush | 8,258,512 | 67.91% | |
| Republican | Bob Dole | 2,333,375 | 19.19% | |
| Republican | Pat Robertson | 1,097,446 | 9.02% | |
| Republican | Jack Kemp | 331,333 | 2.72% | |
| Republican | Uncommitted | 56,990 | 0.47% | |
| Republican | Pierre S. du Pont, IV | 49,783 | 0.41% | |
| Republican | Alexander M. Haig | 26,619 | 0.22% | |
| Republican | Harold Stassen | 2,682 | 0.02% | |
| Total votes | 12,156,740 | 100.00% | ||
| Party | Candidate | Votes | % | |
|---|---|---|---|---|
| Republican | George H. W. Bush | 2,277 | 100.00% | |
| Total votes | 2,277 | 100.00% | ||

Bush: 426 votes (40 states)
Dukakis: 111 votes (10 states + DC)
Bentsen: 1 vote (faithless elector)
| Party | Candidate | Votes | % | |
|---|---|---|---|---|
| Republican | George H. W. Bush / Dan Quayle | 48,886,597 | 53.37% | |
| Democratic | Michael Dukakis / Lloyd Bentsen | 41,809,476 | 45.65% | |
| Libertarian | Ron Paul / Andre Marrou | 431,750 | 0.47% | |
| New Alliance | Lenora Fulani / Joyce Dattner | 217,221 | 0.24% | |
| N/A | Others | 249,642 | 0.27% | |
| Total votes | 91,594,686 | 100.00% | ||
1992
[edit]| Party | Candidate | Votes | % | |
|---|---|---|---|---|
| Republican | George H. W. Bush (incumbent) | 9,199,463 | 72.84% | |
| Republican | Pat Buchanan | 2,899,488 | 22.96% | |
| Republican | Uncommitted | 287,383 | 2.28% | |
| Republican | David Duke | 119,115 | 0.94% | |
| Republican | Ross Perot | 56,136 | 0.44% | |
| Republican | Pat Paulsen | 10,984 | 0.09% | |
| Republican | Maurice Horton | 9,637 | 0.08% | |
| Republican | Harold Stassen | 8,099 | 0.06% | |
| Total votes | 3,390,842 | 100.00% | ||
| Party | Candidate | Votes | % | |
|---|---|---|---|---|
| Republican | George H. W. Bush (incumbent) | 2,189 | 99.05% | |
| Republican | Pat Buchanan | 18 | 0.81% | |
| Republican | Howard Phillips | 2 | 0.09% | |
| Republican | Alan Keyes | 1 | 0.05% | |
| Total votes | 2,210 | 100.00% | ||
| Party | Candidate | Votes | % | |
|---|---|---|---|---|
| Right to Life | George H. W. Bush (incumbent) | unopposed | 100.00% | |

Clinton: 370 votes (32 states + DC)
Bush: 168 votes (18 states)
| Party | Candidate | Votes | % | |
|---|---|---|---|---|
| Democratic | Bill Clinton / Al Gore | 44,909,889 | 43.01% | |
| Republican | George H. W. Bush (incumbent)/ Dan Quayle (incumbent) | 39,104,550 | 37.45% | |
| Independent | Ross Perot / James Stockdale | 19,743,821 | 18.91% | |
| Libertarian | Andre Marrou / Nancy Lord | 290,087 | 0.28% | |
| Populist | Bo Gritz / Cyril Minett | 106,152 | 0.10% | |
| New Alliance | Lenora Fulani / Maria Elizabeth Muñoz | 73,622 | 0.07% | |
| N/A | Others | 195,885 | 18.76% | |
| Total votes | 104,423,923 | 100.00% | ||
See also
[edit]- Electoral history of Al Gore
- Electoral history of Bill Clinton
- Electoral history of Bob Dole
- Electoral history of Dan Quayle
- Electoral history of Dick Cheney
- Electoral history of George W. Bush
- Electoral history of Jimmy Carter
- Electoral history of Ronald Reagan
- Electoral history of Walter Mondale


