From Wikipedia, the free encyclopedia
The Demographics of West Midlands County is analysed by the Office for National Statistics and data is produced for each of its seven metropolitan boroughs and the county overall.
 Population density in the 2011 census in the West Midlands.
Ethnicity[edit]
| Ethnic Group
|
Year
|
| 1966 estimations[1]
|
1971 estimations[2]
|
1981 estimations[3]
|
1991 census[4]
|
2001 census[5]
|
2011 census[6]
|
2021 census[7]
|
| Number
|
%
|
Number
|
%
|
Number
|
%
|
Number
|
%
|
Number
|
%
|
Number
|
%
|
Number
|
%
|
|
|
|
|
|
|
|
|
|
|
|
|
|
|
|
|
| White: Total
|
–
|
–
|
2,580,903
|
93.2%
|
2,371,072
|
88.7%
|
2,237,135
|
85.1%
|
2,043,231
|
80%
|
1,919,138
|
70.1%
|
1,793,173
|
61.4%
|
| White: British
|
–
|
–
|
–
|
–
|
–
|
–
|
–
|
–
|
1,956,156
|
76.5%
|
1,806,708
|
66%
|
1,630,823
|
55.9%
|
| White: Irish
|
–
|
–
|
–
|
–
|
–
|
–
|
–
|
–
|
54,011
|
2.1%
|
39,183
|
1.4%
|
31,490
|
1.1%
|
| White: Gypsy or Irish Traveller
|
–
|
–
|
–
|
–
|
–
|
–
|
–
|
–
|
–
|
–
|
1,618
|
|
2,417
|
|
| White: Roma
|
–
|
–
|
–
|
–
|
–
|
–
|
–
|
–
|
–
|
–
|
–
|
–
|
4,246
|
|
| White: Other
|
–
|
–
|
–
|
–
|
–
|
–
|
–
|
–
|
33,064
|
1.3%
|
71,629
|
2.6%
|
124,197
|
4.3%
|
| Asian or Asian British: Total
|
–
|
–
|
–
|
–
|
206,289
|
7.7%
|
276,162
|
10.5%
|
352,288
|
13.8%
|
514,981
|
18.8%
|
667,315
|
22.9%
|
| Asian or Asian British: Indian
|
–
|
–
|
–
|
–
|
118,101
|
4.4%
|
148,320
|
5.6%
|
157,062
|
6.1%
|
185,271
|
6.8%
|
226,927
|
7.8%
|
| Asian or Asian British: Pakistani
|
–
|
–
|
–
|
–
|
65,985
|
2.5%
|
93,426
|
3.6%
|
138,007
|
5.4%
|
200,545
|
7.3%
|
278,837
|
9.6%
|
| Asian or Asian British: Bangladeshi
|
–
|
–
|
–
|
–
|
11,006
|
0.4%
|
19,131
|
0.7%
|
29,085
|
1.1%
|
48,727
|
|
72,168
|
2.5%
|
| Asian or Asian British: Chinese
|
–
|
–
|
–
|
–
|
4,543
|
0.2%
|
6,119
|
0.2%
|
10,548
|
0.4%
|
21,430
|
|
22,718
|
0.8%
|
| Asian or Asian British: Other Asian
|
–
|
–
|
–
|
–
|
6,654
|
|
9,166
|
|
17,586
|
|
59,008
|
|
66,665
|
2.3%
|
| Black or Black British: Total
|
–
|
–
|
–
|
–
|
80,412
|
3%
|
96,384
|
3.7%
|
95,234
|
3.7%
|
164,069
|
6%
|
236,047
|
8.1%
|
| Black or Black British: African
|
–
|
–
|
–
|
–
|
3,602
|
0.1%
|
4,134
|
0.2%
|
10,000
|
0.4%
|
55,557
|
2%
|
126,041
|
4.3%
|
| Black or Black British: Caribbean
|
–
|
–
|
–
|
–
|
63,597
|
2.4%
|
75,612
|
2.9%
|
76,386
|
3%
|
79,632
|
2.9%
|
81,732
|
2.8%
|
| Black or Black British: Other Black
|
–
|
–
|
–
|
–
|
13,213
|
|
16,638
|
0.6%
|
8,848
|
0.3%
|
28,880
|
|
28,274
|
1%
|
| Mixed: Total
|
–
|
–
|
–
|
–
|
–
|
–
|
–
|
–
|
54,757
|
2.1%
|
96,204
|
3.5%
|
121,685
|
4.2%
|
| Mixed: White and Black Caribbean
|
–
|
–
|
–
|
–
|
–
|
–
|
–
|
–
|
31,525
|
1.2%
|
53,234
|
1.9%
|
59,903
|
2.1%
|
| Mixed: White and Black African
|
–
|
–
|
–
|
–
|
–
|
–
|
–
|
–
|
2,446
|
|
6,053
|
|
9,735
|
|
| Mixed: White and Asian
|
–
|
–
|
–
|
–
|
–
|
–
|
–
|
–
|
12,641
|
|
21,964
|
|
28,872
|
|
| Mixed: Other Mixed
|
–
|
–
|
–
|
–
|
–
|
–
|
–
|
–
|
8,145
|
|
14,953
|
|
23,175
|
|
| Other: Total
|
–
|
–
|
–
|
–
|
15,327
|
0.5%
|
19,719
|
0.7%
|
10,082
|
0.4%
|
42,068
|
1.5%
|
101,435
|
3.5%
|
| Other: Arab
|
–
|
–
|
–
|
–
|
–
|
–
|
–
|
–
|
–
|
–
|
16,029
|
|
28,083
|
1%
|
| Other: Any other ethnic group
|
–
|
–
|
–
|
–
|
–
|
–
|
–
|
–
|
10,082
|
0.4%
|
26,039
|
|
73,352
|
2.5%
|
|
|
|
|
|
|
|
|
|
|
|
|
|
|
|
|
| Ethnic minority: Total
|
102,850
|
–
|
188,306
|
6.8%
|
302,027
|
11.3%
|
392,265
|
14.9%
|
512,361
|
20%
|
817,322
|
29.9%
|
1,126,482
|
38.6%
|
|
|
|
|
|
|
|
|
|
|
|
|
|
|
|
|
| Total
|
–
|
100%
|
2,769,209
|
100%
|
2,673,099
|
100%
|
2,629,400
|
100%
|
2,555,592
|
100%
|
2,736,460
|
100%
|
2,919,655
|
100%
|
Distribution of ethnic groups in the West Midlands according to the 2011 census.
-
White
-
White-British
-
White-Irish
-
White-Other
-
Asian
-
Asian-Indian
-
Asian-Pakistani
-
Asian-Bangladeshi
-
Asian-Chinese
-
Black
-
Black-African
-
Black-Caribbean
-
Other-Arab
Country of birth[edit]
| Country of birth
|
2021[8]
|
| Number
|
%
|
|
|
|
|
| United Kingdom
|
2,286,558
|
78.3%
|
| EU Countries
|
165,431
|
5.7%
|
| Other European
|
15,241
|
0.5%
|
| Africa
|
102,205
|
3.5%
|
| Middle East and Asia
|
308,122
|
10.6%
|
| Caribbean and Americas
|
37,477
|
1.3%
|
| Oceania
|
2,275
|
0.1%
|
| British Overseas
|
2,340
|
0.1%
|
|
|
|
|
| Overall
|
2,919,649
|
100%
|
Religion[edit]
| Religion
|
2001[9]
|
2021[10]
|
| Number
|
%
|
Number
|
%
|
| No religion
|
305,365
|
11.9%
|
814,372
|
27.9%
|
| Christian
|
1,701,519
|
66.5%
|
1,189,066
|
40.7%
|
| Buddhist
|
5,817
|
|
9,380
|
|
| Hindu
|
49,484
|
|
68,376
|
|
| Jewish
|
3,310
|
|
2,559
|
|
| Muslim
|
191,559
|
7.5%
|
501,480
|
17.2%
|
| Sikh
|
91,890
|
|
148,937
|
|
| Other religion
|
5,381
|
|
17,805
|
|
| Not answered
|
201,267
|
|
167,685
|
|
| Total
|
2,555,592
|
100%
|
2,919,660
|
100%
|
Distribution of religions in the West Midlands according to the 2011 census.
-
Christianity
-
Islam
-
Judaism
-
Hinduism
-
Sikhism
-
Buddhism
-
Other religion
-
No religion
Housing[edit]
| Tenure
|
2001[11]
|
2021[12]
|
| Number
|
%
|
Number
|
%
|
| Owned
|
667,665
|
|
657,680
|
|
| Social renting
|
262,163
|
|
248,490
|
|
| Private renting
|
73,373
|
|
221,929
|
|
| Rent free
|
29,743
|
|
3,661
|
|
| Total
|
1,032,944
|
100%
|
1,131,760
|
|
References[edit]


 White
White White-British
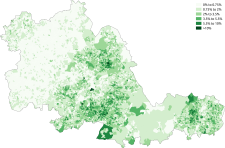 White-Irish
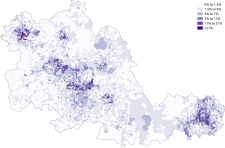 White-Other
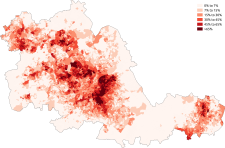 Asian
Asian Asian-Indian
 Asian-Pakistani
 Asian-Bangladeshi
 Asian-Chinese
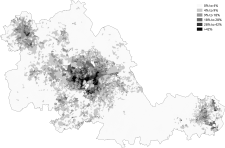 Black
Black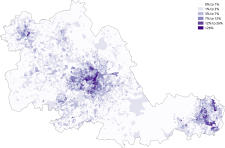 Black-African
 Black-Caribbean
 Other-Arab


 Christianity
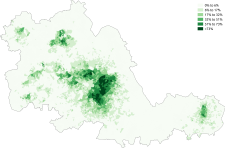 Islam
Islam Judaism
 Hinduism
 Sikhism
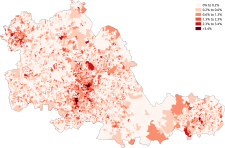 Buddhism
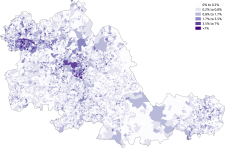 Other religion
 No religion


