From Wikipedia, the free encyclopedia
Russian legislative constituency
| Buryatia single-member constituency |
|---|
|
 |
| Deputy | |
|---|
| Federal subject | Republic of Buryatia |
|---|
| Districts | Barguzinsky, Bauntovsky, Bichursky, Dzhidinsky, Ivolginsky, Kabansky, Khorinsky, Kizhinginsky, Kurumkansky, Kyakhtinsky, Muysky, Mukhorshibirsky, Okinsky, Pribaykalsky, Selenginsky, Severo-Baykalsky, Severobaykalsk, Tarbagataysky, Tunkinsky, Ulan-Ude, Yeravninsky, Zaigrayevsky, Zakamensky[1] |
|---|
| Voters | 695,619 (2021)[2] |
|---|
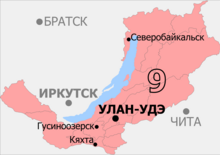
The Buryatia Constituency (No.9[a]) is a Russian legislative constituency in the Republic of Buryatia. The constituency is the only one in Buryatia, and it occupies its whole territory.
Summary of the 17 December 1995 Russian legislative election in the Buryatia constituency
| Candidate
|
Party
|
Votes
|
%
|
|
|
Svetlana Naychukova
|
Independent
|
93,912
|
21.76%
|
|
|
Nikolay Kondakov (incumbent)
|
Communist Party
|
80,260
|
18.60%
|
|
|
Vladimir Belousov
|
Our Home – Russia
|
56,898
|
13.19%
|
|
|
Nimazhap Ilyukhinov
|
Independent
|
35,714
|
8.28%
|
|
|
Arnold Tulokhonov
|
Independent
|
32,745
|
7.59%
|
|
|
Vladimir Markov
|
Independent
|
22,007
|
5.10%
|
|
|
Tsyrzhima Sergeeva
|
Independent
|
19,800
|
4.59%
|
|
|
Vladimir Prokopyev
|
Independent
|
12,001
|
2.78%
|
|
|
Bayar Tumurov
|
Beer Lovers Party
|
7,614
|
1.76%
|
|
|
against all
|
58,328
|
13.52%
|
|
|
| Total
|
431,525
|
100%
|
|
|
| Source:
|
[4]
|
Summary of the 19 December 1999 Russian legislative election in the Buryatia constituency
| Candidate
|
Party
|
Votes
|
%
|
|
|
Bato Semenov
|
Fatherland – All Russia
|
136,960
|
34.99%
|
|
|
Viktor Izmaylov
|
Independent
|
78,421
|
20.03%
|
|
|
Sergey Budazhapov
|
Communist Party
|
54,298
|
13.87%
|
|
|
Svetlana Naychukova (incumbent)
|
Independent
|
21,959
|
5.61%
|
|
|
Vladimir Markov
|
Spiritual Heritage
|
20,888
|
5.34%
|
|
|
Yevgeny Paltsev
|
Independent
|
13,332
|
3.41%
|
|
|
Svetlana Zangeeva
|
Independent
|
6,139
|
1.57%
|
|
|
Oleg Khomutov
|
Independent
|
5,965
|
1.52%
|
|
|
Igor Pronkin
|
Independent
|
5,624
|
1.44%
|
|
|
Tsyrzhima Sergeeva
|
Independent
|
5,327
|
1.36%
|
|
|
against all
|
32,640
|
8.34%
|
|
|
| Total
|
391,466
|
100%
|
|
|
| Source:
|
[5]
|
Summary of the 17-19 September 2021 Russian legislative election in the Buryatia constituency
| Candidate
|
Party
|
Votes
|
%
|
|
|
Vyacheslav Damdintsurunov
|
United Russia
|
115,716
|
37.41%
|
|
|
Bair Tsyrenov
|
Communist Party
|
61,429
|
19.86%
|
|
|
Sergey Zverev
|
The Greens
|
23,081
|
7.46%
|
|
|
Igor Bobkov
|
Party of Pensioners
|
22,692
|
7.34%
|
|
|
Maksim Buvalin
|
New People
|
19,628
|
6.35%
|
|
|
Oksana Bukholtseva
|
A Just Russia — For Truth
|
17,338
|
5.61%
|
|
|
Bayar Tsydenov
|
Civic Platform
|
15,565
|
5.03%
|
|
|
Damdin Bolotov
|
Communists of Russia
|
13,060
|
4.22%
|
|
|
Sergey Dorosh
|
Liberal Democratic Party
|
7,234
|
2.34%
|
|
|
Yevgeny Menshikov
|
Russian Party of Freedom and Justice
|
3,278
|
1.06%
|
|
|
| Total
|
309,304
|
100%
|
|
|
| Source:
|
[8]
|


