From Wikipedia, the free encyclopedia
1994 Swedish European Union membership referendum
Choice
Votes
%
Yes
2,833,721
No
2,539,132
Valid votes
5,372,853
Invalid or blank votes
51,634
Total votes
5,424,487
100.00%
Registered voters/turnout
6,510,055
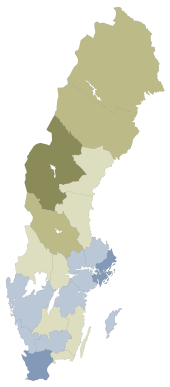
Results by
county
Yes
50%-60%
60%-70%
No
50%-60%
60%-70%
70%-80%
A non-binding referendum on membership for the European Union was held in Sweden on 13 November 1994.[ 1] [ 1]
Among the political parties, the Social Democrats , the Center Party , the Christian Democrats , the Moderates and the People's Party officially supported membership, while the Left Party and the Green Party were opposed. Those who sympathized with the latter four parties also voted largely along the party line, while voters of the former three parties were more evenly split between the two sides.
Choice Votes % For 2,833,721 52.74 Against 2,539,132 47.26 Total 5,372,853 100.00 Valid votes 5,372,853 99.05 Invalid votes 2,697 0.05 Blank votes 48,937 0.90 Total votes 5,424,487 100.00 Registered voters/turnout 6,510,055 83.32 Source: Nationalencyklopedin [ 2]
Region
Yes
% Yes
No
% No
Electorate
Votes
Valid
Invalid votes
Stockholm
623,496
62.03
381,635
37.97
1,216,980
1,014,869
1,005,131
9,738
Uppsala
92,167
53.96
78,636
46.04
205,736
172,747
170,803
1,944
Södermanland
86,083
54.31
72,430
45.69
191,199
160,141
158,513
1,628
Östergötland
139,697
54.49
116,689
45.51
309,509
259,312
256,386
2,926
Örebro
81,423
47.47
90,109
52.53
208,184
173,286
171,532
1,754
Västmanland
87,058
54.81
71,778
45.19
193,184
160,400
158,836
1,564
Jönköping
100,072
48.89
104,616
51.11
242,805
206,545
204,688
1,857
Kronoberg
58,015
51.87
53,824
48.13
134,559
113,019
111,839
1,180
Kalmar
73,207
48.74
76,987
51.26
184,802
151,649
150,194
1,455
Gotland
17,996
51.40
17,017
48.60
43,878
35,399
35,013
386
Blekinge
45,098
46.90
51,065
53.10
116,586
97,106
96,163
943
Skåne
422,567
63.23
245,696
36.77
818,810
674,619
668,263
6,356
Halland
97,222
58.44
69,150
41.56
197,757
168,244
166,372
1,872
Västra Götaland
466,591
51.99
430,924
48.01
1,085,238
906,508
897,515
8,993
Värmland
84,627
47.46
93,703
52.54
217,170
179,875
178,330
1,545
Dalarna
71,253
39.06
111,150
60.94
220,141
184,047
182,403
1,644
Gävleborg
74,767
41.69
104,583
58.31
222,780
180,980
179,350
1,630
Västernorrland
69,582
41.96
96,233
58.04
201,394
167,081
165,815
1,266
Jämtland
24,714
27.94
63,731
72.06
104,798
89,121
88,445
676
Västerbotten
60,071
37.23
101,285
62.77
193,374
162,532
161,356
1,176
Norrbotten
58,015
34.97
107,891
65.03
201,171
167,007
165,906
1,101
Source: Dataset European Election Database Archived 2020-08-31 at the Wayback Machine


