1984 United States presidential election in New Jersey
| ||||||||||||||||||||||||||
| ||||||||||||||||||||||||||
 County Results
| ||||||||||||||||||||||||||
| ||||||||||||||||||||||||||
| Elections in New Jersey |
|---|
 |

The 1984 United States presidential election in New Jersey took place on November 6, 1984. All 50 states and the District of Columbia, were part of the 1984 United States presidential election. Voters chose 16 electors to the Electoral College, which selected the president and vice president.
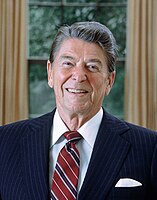
New Jersey was won by the Republican nominees, incumbent President Ronald Reagan of California and incumbent Vice President George H.W. Bush of Texas. Reagan and Bush defeated the Democratic nominees, former Vice President Walter Mondale of Minnesota and his running mate Congresswoman Geraldine Ferraro of New York.
Reagan carried New Jersey with 60.09% of the vote to Mondale’s 39.20%, a margin of 20.89%.[1]
Reagan also swept nearly every county in the state. Mondale’s only county victory was Essex County, where he defeated Reagan 55.1%–43.5%. This remains the last election in which a Republican presidential nominee has won heavily Democratic Hudson County and Mercer County,[2] both of which narrowly defected to Reagan in 1984 primarily due to the support of working-class Reagan Democrats. Reagan's 1.93 million votes was the most received by a Republican in a presidential election in the state's history until Donald Trump received nearly 1.97 million votes in the state in 2024.[3]
New Jersey weighed in for this election as 2.7% more Republican than the national average.
Campaign
[edit]Jesse Jackson's voters were 81% black, 13% white, 4% Hispanic, and 2% were members of other groups.[4]
Results
[edit]| 1984 United States presidential election in New Jersey | |||||
|---|---|---|---|---|---|
| Party | Candidate | Votes | Percentage | Electoral votes | |
| Republican | Ronald Reagan (incumbent) | 1,933,630 | 60.09% | 16 | |
| Democratic | Walter Mondale | 1,261,323 | 39.20% | 0 | |
| Workers World | Larry Holmes | 8,404 | 0.26% | 0 | |
| Libertarian | David Bergland | 6,416 | 0.20% | 0 | |
| New Alliance | Dennis Serrette | 2,293 | 0.07% | 0 | |
| Workers League | Edward Winn | 537 | 0.02% | 0 | |
| Communist Party | Gus Hall | 1,564 | 0.05% | 0 | |
| Socialist Workers | Melvin T. Mason | 1,264 | 0.04% | 0 | |
| Citizens | Sonia Johnson | 1,247 | 0.04% | 0 | |
| Totals | 3,217,862 | 100.0% | 16 | ||
| Voter Turnout (Voting age/Registered) | 57%/79% | ||||
Results by county
[edit]| County | Ronald Reagan Republican |
Walter Mondale Democratic |
Various candidates Other parties |
Margin | Total votes cast | ||||
|---|---|---|---|---|---|---|---|---|---|
| # | % | # | % | # | % | # | % | ||
| Atlantic | 49,158 | 59.33% | 33,240 | 40.12% | 453 | 0.55% | 15,918 | 19.21% | 82,851 |
| Bergen | 268,507 | 63.22% | 155,039 | 36.50% | 1,172 | 0.28% | 113,468 | 26.72% | 424,718 |
| Burlington | 89,815 | 60.83% | 57,467 | 38.92% | 377 | 0.26% | 32,348 | 21.91% | 147,659 |
| Camden | 109,749 | 54.63% | 90,233 | 44.92% | 904 | 0.45% | 19,516 | 9.71% | 200,886 |
| Cape May | 28,786 | 68.06% | 13,378 | 31.63% | 133 | 0.31% | 15,408 | 36.43% | 42,297 |
| Cumberland | 29,398 | 57.47% | 21,141 | 41.33% | 616 | 1.20% | 8,257 | 16.14% | 51,155 |
| Essex | 136,798 | 43.49% | 173,295 | 55.09% | 4,450 | 1.41% | -36,497 | -11.60% | 314,543 |
| Gloucester | 54,041 | 62.08% | 32,702 | 37.57% | 307 | 0.35% | 21,339 | 24.51% | 87,050 |
| Hudson | 112,834 | 54.18% | 94,304 | 45.29% | 1,106 | 0.53% | 18,530 | 8.89% | 208,244 |
| Hunterdon | 29,737 | 72.39% | 10,972 | 26.71% | 370 | 0.90% | 18,765 | 45.68% | 41,079 |
| Mercer | 71,195 | 51.55% | 66,398 | 48.07% | 528 | 0.38% | 4,797 | 3.48% | 138,121 |
| Middlesex | 160,221 | 59.82% | 104,905 | 39.17% | 2,727 | 1.02% | 55,316 | 20.65% | 267,853 |
| Monmouth | 152,595 | 65.52% | 79,382 | 34.08% | 932 | 0.40% | 73,213 | 31.44% | 232,909 |
| Morris | 137,719 | 71.91% | 53,201 | 27.78% | 584 | 0.30% | 84,518 | 44.13% | 191,504 |
| Ocean | 124,391 | 70.23% | 51,012 | 28.80% | 1,710 | 0.97% | 73,379 | 41.43% | 177,113 |
| Passaic | 101,951 | 58.28% | 69,590 | 39.78% | 3,399 | 1.94% | 32,361 | 18.50% | 174,940 |
| Salem | 17,368 | 65.66% | 8,935 | 33.78% | 149 | 0.56% | 8,433 | 31.88% | 26,452 |
| Somerset | 66,303 | 66.77% | 31,924 | 32.15% | 1,069 | 1.08% | 34,379 | 34.62% | 99,296 |
| Sussex | 35,680 | 75.36% | 11,502 | 24.29% | 163 | 0.34% | 24,178 | 51.07% | 47,345 |
| Union | 135,446 | 59.11% | 92,056 | 40.17% | 1,638 | 0.71% | 43,390 | 18.94% | 229,140 |
| Warren | 21,938 | 67.07% | 10,647 | 32.55% | 122 | 0.37% | 11,291 | 34.52% | 32,707 |
| Totals | 1,933,630 | 60.09% | 1,261,323 | 39.20% | 22,909 | 0.71% | 672,307 | 20.89% | 3,217,862 |
Counties that flipped from Democratic to Republican
[edit]See also
[edit]References
[edit]- ^ "1984 Presidential General Election Results - New Jersey". Dave Leip's Atlas of U.S. Presidential Elections. Retrieved November 14, 2013.
- ^ Sullivan, Robert David; ‘How the Red and Blue Map Evolved Over the Past Century’; America Magazine in The National Catholic Review; June 29, 2016
- ^ "Presidential Election 2024 Live Results: Donald Trump wins". www.nbcnews.com. November 22, 2024. Retrieved November 22, 2024.
- ^ Ranney 1985, p. 54.
Works cited
[edit]- Ranney, Austin, ed. (1985). The American Elections of 1984. Duke University Press. ISBN 0822302306.


