Visual pollution

| Part of a series on |
| Pollution |
|---|
 |
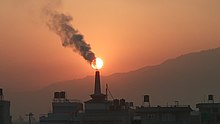
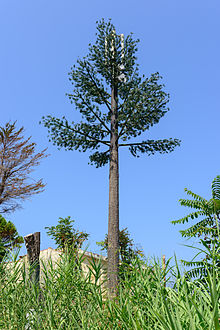
Visual pollution is the degradation of the visual environment due to unattractive or disruptive elements that negatively impact the aesthetic quality of an area. It can affect urban, suburban, and natural landscapes.[1] It also refers to the impacts pollution has in impairing the quality of the landscape, formed from compounding sources of pollution to create the impairment. Visual pollution disturbs the functionality and enjoyment of a given area, limiting the ability for the wider ecological system, from humans to animals, to prosper and thrive within it due to the disruptions to their natural and human-made habitats. Although visual pollution can be caused by natural sources (e.g. wildfires), the predominant cause comes from human sources.[2]
As such, visual pollution is not considered a primary source of pollution but a secondary symptom of intersecting pollution sources. Its secondary nature and subjective aspect sometimes makes it difficult to measure and engage with[3][4] (e.g. within quantitative figures for policymakers). However, the history of the word pollution, and pollution's effect over time, reveals the fact that every form of pollution can be categorised and studied in its three main characteristics, namely contextual, subjective and complex.[1] Frameworks for measurement have been established and include public opinion polling and surveys, visual comparison, spatial metrics, and ethnographic work.[5][6][7][8][9]
Visual pollution can manifest across levels of analysis, from micro instances that effect the individual to macro issues that impact society as a whole. Instances of visual pollution can take the form of plastic bags stuck in trees, advertisements with contrasting colors and content, which create an oversaturation of anthropogenic visual information within a landscape,[10][11] to community-wide impacts of overcrowding, overhead power lines, or congestion. Poor urban planning and irregular built-up environments contrast with natural spaces, creating alienating landscapes.[8][12] Using Pakistan as a case study, a detailed analysis of all visual pollution objects was published in 2022.[1]
The effects of visual pollution have primary symptoms, such as distraction, eye fatigue, decreases in opinion diversity, and loss of identity.[8] It has also been shown to increase biological stress responses and impair balance.[13] As a secondary source of pollution, these also compound with the impact of its primary source such as light or noise pollution that can create multi-layered public health concerns and crisis.
Sources
[edit]
Local managers of urban areas sometimes lack control over what is built and assembled in public places. As businesses look for ways to increase the profits, cleanliness, architecture, logic and use of space in urban areas are suffering from visual clutter.[14] Variations in the built environment are determined by the location of street furniture such as public transport stations, garbage cans, large panels and stalls. Insensitivity of local administration is another cause for visual pollution. For example, poorly planned buildings and transportation systems create visual pollution. High-rise buildings, if not planned properly or sufficiently, can bring adverse change to the visual and physical characteristics of a city, which may reduce said city's readability.[8]
A frequent criticism of advertising is that there is too much of it.[14] Billboards, for example, have been alleged to distract drivers, corrupt public taste, promote meaningless and wasteful consumerism and clutter the land.[12] See highway beautification. Vandalism, in the form of graffiti, is defined as street markings, offensive, inappropriate, and tasteless messages made without the owner's consent.[14] Graffiti adds to visual clutter as it disturbs the view.
Visual Pollution Assessment
[edit]The process of measuring, quantifying or assessing the level of visual pollution at any place is called a visual pollution assessment (VPA).[9] In past few years,[as of?] the demand for methods to assess visual pollution in communities has increased. Recently, a tool was introduced for visual pollution measurement which can be used to measure the presence of various visual pollution objects (VPOs) and the resultant level of visual pollution. A detailed analysis of visual pollution, its context, case studies and analysis using the tool is discussed in Visual Pollution: Concepts, Practices and Management Framework by Nawaz et al.[1]
Prevention
[edit]United States
[edit]In the United States, there are several initiatives gradually taking place to prevent visual pollution. The Federal Highway Beautification Act of 1965 limits placement of billboards on Interstate highways and federally aided roads. It has dramatically reduced the amount of billboards placed on these roads.[12] Another highway bill, the Intermodal Surface Transportation Efficiency Act (ISTEA) of 1991 has made transportation facilities sync with the needs of communities. This bill created a system of state and national scenic byways and provided funds for biking trails, historic preservation and scenic conservation.[15]
Businesses situated near an interstate can create problems of advertising through large billboards; however, now an alternative solution for advertisers is gradually eliminating the problem. For example, logo signs that provide directional information for travelers without disfiguring the landscape are increasing and are a step toward decreasing visual pollution on highways in America.[15]
Brazil
[edit]In September 2006, São Paulo passed the Cidade Limpa (Clean City Law), outlawing the use of all outdoor advertisements, including on billboards, transit, and in front of stores.[16]
See also
[edit]References
[edit]- ^ a b c d Nawaz, Raheel; Wakil, Khydija (13 October 2022). Visual Pollution: Concepts, Practices and Management Framework. Bingley: Emerald Publishing Limited. doi:10.1108/978-1-80382-041-520221006. ISBN 978-1-80382-042-2.
- ^ Borowiak, Klaudia; Budka, Anna; Lisiak-Zielińska, Marta; Robaszkiewicz, Kinga; Cakaj, Arlinda; Agaj, Tropikë (2024-03-13). "Urban visual pollution: comparison of two ways of evaluation—a case study from Europe". Scientific Reports. 14 (1): 6138. doi:10.1038/s41598-024-56403-9. ISSN 2045-2322. PMC 10937664.
- ^ Portella, Adriana (2016). Visual pollution: advertising, signage and environmental quality. London: Routledge. ISBN 978-1-138-27376-4. OCLC 1010680073.
- ^ Flad, Harvey K. (1997). "Country Clutter: Visual Pollution and the Rural Roadscape". The Annals of the American Academy of Political and Social Science. 553 (1): 117–129. doi:10.1177/0002716297553001011. ISSN 0002-7162. S2CID 60447315.
- ^ Chmielewski, Szymon (2020-12-12). "Chaos in Motion: Measuring Visual Pollution with Tangential View Landscape Metrics". Land. 9 (12): 515. doi:10.3390/land9120515. ISSN 2073-445X.
- ^ Da Silva, Marina. "Visual Pollution". designwithme.co.uk. Retrieved 2021-07-04.
- ^ Chmielewski, Szymon; Lee, Danbi J.; Tompalski, Piotr; Chmielewski, Tadeusz J.; Wężyk, Piotr (2016-04-02). "Measuring visual pollution by outdoor advertisements in an urban street using intervisibilty analysis and public surveys". International Journal of Geographical Information Science. 30 (4): 801–818. doi:10.1080/13658816.2015.1104316. ISSN 1365-8816. S2CID 425572.
- ^ a b c d Yilmaz, Demet; Sagsoz, Ayse (28 April 2011). "In the Context of Visual Pollution: Effects to Trabzon City Center Silhoutte". Asian Social Science. 7 (5). doi:10.5539/ass.v7n5p98.
- ^ a b Wakil, Khydija; Naeem, Malik Asghar; Anjum, Ghulam Abbas; Waheed, Abdul; Thaheem, Muhammad Jamaluddin; Hussnain, Muhammad Qadeer ul; Nawaz, Raheel (January 2019). "A Hybrid Tool for Visual Pollution Assessment in Urban Environments". Sustainability. 11 (8): 2211. doi:10.3390/su11082211. hdl:10536/DRO/DU:30123294.
- ^ Chmielewski, Szymon; Lee, Danbi J.; Tompalski, Piotr; Chmielewski, Tadeusz J.; Wężyk, Piotr (4 November 2015). "Measuring visual pollution by outdoor advertisements in an urban street using intervisibility analysis and public surveys". International Journal of Geographical Information Science. 30 (4): 801–818. doi:10.1080/13658816.2015.1104316. S2CID 425572.
- ^ Chmielewski, Szymon (November 2020). "Chaos in motion: Measuring Visual Pollution with Tangential View Landscape Metrics". Land. 9(12), 515 (12): 515. doi:10.3390/land9120515.
- ^ a b c Nagle, John (1 January 2012). "Cell Phone Towers as Visual Pollution". Notre Dame Journal of Law, Ethics & Public Policy. 23 (2): 537. SSRN 1463592.
- ^ Wibble, Tobias; Södergård, Ulrika; Träisk, Frank; Pansell, Tony (3 January 2020). "Intensified visual clutter induces increased sympathetic signalling, poorer postural control, and faster torsional eye movements during visual rotation". PLOS ONE. 15 (1): e0227370. doi:10.1371/journal.pone.0227370. PMC 6941927. PMID 31900468.
- ^ a b c Morozan, Cristian; Enache, Elena; Purice, Suzan (December 2012). "Visual Pollution: A New Axiological Dimension Of Marketing?" (PDF). Annals of the University of Oradea: 820–826. S2CID 151162637.
- ^ a b Maguire, Meg; Foote, Ray; Vespe, Frank (30 September 1997). "Beauty as well as Bread". Journal of the American Planning Association. 63 (3): 317–328. doi:10.1080/01944369708975925. ProQuest 229617956.
- ^ Rohter, Larry (2006-12-12). "Billboard ban in São Paulo angers advertisers". The New York Times. ISSN 0362-4331. Retrieved 2023-09-16.
External links
[edit]- "Visual Pollution - Albuquerque's Environmental Story". Friends of Albuquerque's Environmental Story.
- "Visual pollution". The Economist. 11 October 2007.
- "Seven Principles of Scenic Conservation". Scenic America. 18 September 2019.


