2004 United States presidential election in Louisiana
| ||||||||||||||||||||||||||
| ||||||||||||||||||||||||||
 Parish Results
| ||||||||||||||||||||||||||
| ||||||||||||||||||||||||||
| Elections in Louisiana |
|---|
 |
|
|
The 2004 United States presidential election in Louisiana took place on November 2, 2004, and was part of the 2004 United States presidential election. Voters chose nine representatives, or electors to the Electoral College, who voted for president and vice president.
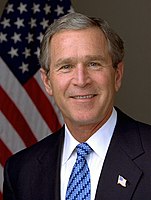
Louisiana was won by incumbent President George W. Bush by a 14.5 percent margin. Prior to the election, all twelve news organizations considered this a state Bush would win, or otherwise a red state. Bush's performance constituted a much wider margin than that of his 2000 results, which were 6.8 percent smaller. The state, like other states in the Deep South, is racially polarized when it comes to presidential elections, as a wide majority of the white population votes Republican, and a wide majority of the black population votes Democratic.
In this election, Louisiana voted 12.05% to the right of the nation at-large.[1]
Primaries
[edit]Campaign
[edit]Predictions
[edit]There were 12 news organizations who made state-by-state predictions of the election. Here are their last predictions before election day.[2]
| Source | Ranking |
|---|---|
| D.C. Political Report | Lean R |
| Cook Political Report | Solid R |
| Research 2000 | Solid R |
| Zogby International | Likely R |
| Washington Post | Likely R |
| Washington Dispatch | Likely R |
| Washington Times | Solid R |
| The New York Times | Solid R |
| CNN | Likely R |
| Newsweek | Solid R |
| Associated Press | Lean R |
| Rasmussen Reports | Likely R |
Polling
[edit]Bush won every single pre-election poll, and won each with at least 48 percent of the vote. The final 3 polls averaged Bush leading 51 to 39 percent.[3]
Fundraising
[edit]Bush raised $1,933,549.[4] Kerry raised $1,303,859.[5]
Advertising and visits
[edit]Neither campaign advertised or visited this state during the fall election.[6][7]
Analysis
[edit]Bush performed better here than he did in 2000. He won four more parishes: Caddo, Bienville, Saint Landry, and West Baton Rouge, but he won each with very slim margins of victory of less than two percent, except for West Baton Rouge which he won with 54 percent of the vote, indicating that parish as trending Republican. In the northern portion of the state, Bush barely lost in Madison and Tensas. The only two parishes in which he got less than forty percent of the vote were East Carroll and Orleans. Bush also won six of seven congressional districts in the state, each with at least 58 percent of the vote. The Second District, which covers the parish and city of Orleans, was won by Kerry with seventy percent of the vote; in other words, no congressional district in the state was competitive. As of the 2024 presidential election[update], this is the last election in which East Baton Rouge Parish and Caddo Parish voted for a Republican presidential candidate.[8] Conversely, this is the last election in which Assumption Parish and Pointe Coupee Parish voted for a Democratic presidential candidate.[8]
Results
[edit]| 2004 United States presidential election in Louisiana[9] | |||||
|---|---|---|---|---|---|
| Party | Candidate | Votes | Percentage | Electoral votes | |
| Republican | George W. Bush (incumbent) | 1,102,169 | 56.72% | 9 | |
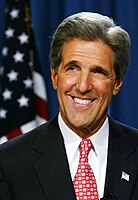
| Democratic | John Kerry | 820,299 | 42.22% | 0 | |
| Independent | Ralph Nader | 7,032 | 0.36% | 0 | |
| American Independent | Michael Peroutka | 5,203 | 0.27% | 0 | |
| Libertarian | Michael Badnarik | 2,781 | 0.14% | 0 | |
| Independent | Walt Brown | 1,795 | 0.09% | 0 | |
| Independent | Gene Amondson | 1,566 | 0.08% | 0 | |
| Green | David Cobb | 1,276 | 0.07% | 0 | |
| Socialist Workers | James Harris | 985 | 0.05% | 0 | |
| Invalid or blank votes | 169,510 | 1.35% | — | ||
| Totals | 1,943,106 | 100.00% | 9 | ||
| Voter turnout (Voting age population) | 58.5% | ||||
Results by parish
[edit]| Parish | George W. Bush Republican |
John Kerry Democratic |
Various candidates Other parties |
Margin | Total votes cast | ||||
|---|---|---|---|---|---|---|---|---|---|
| # | % | # | % | # | % | # | % | ||
| Acadia | 16,083 | 63.75% | 8,937 | 35.42% | 210 | 0.83% | 7,146 | 28.33% | 25,230 |
| Allen | 5,140 | 56.33% | 3,791 | 41.55% | 193 | 2.12% | 1,349 | 14.78% | 9,124 |
| Ascension | 24,661 | 63.07% | 13,955 | 35.69% | 484 | 1.24% | 10,706 | 27.38% | 39,100 |
| Assumption | 4,966 | 46.26% | 5,585 | 52.03% | 184 | 1.71% | -619 | -5.77% | 10,735 |
| Avoyelles | 8,302 | 53.48% | 6,976 | 44.93% | 247 | 1.59% | 1,326 | 8.55% | 15,525 |
| Beauregard | 9,470 | 71.30% | 3,666 | 27.60% | 145 | 1.09% | 5,804 | 43.70% | 13,281 |
| Bienville | 3,612 | 50.47% | 3,399 | 47.49% | 146 | 2.04% | 213 | 2.98% | 7,157 |
| Bossier | 30,040 | 70.34% | 12,317 | 28.84% | 348 | 0.81% | 17,723 | 41.50% | 42,705 |
| Caddo | 54,292 | 50.93% | 51,739 | 48.54% | 564 | 0.53% | 2,553 | 2.39% | 106,595 |
| Calcasieu | 46,075 | 57.81% | 32,864 | 41.24% | 759 | 0.95% | 13,211 | 16.57% | 79,698 |
| Caldwell | 3,308 | 69.61% | 1,384 | 29.12% | 60 | 1.26% | 1,924 | 40.49% | 4,752 |
| Cameron | 3,190 | 68.75% | 1,367 | 29.46% | 83 | 1.79% | 1,823 | 39.29% | 4,640 |
| Catahoula | 3,219 | 64.98% | 1,673 | 33.77% | 62 | 1.25% | 1,546 | 31.21% | 4,954 |
| Claiborne | 3,704 | 55.87% | 2,854 | 43.05% | 72 | 1.09% | 850 | 12.82% | 6,630 |
| Concordia | 5,427 | 60.43% | 3,446 | 38.37% | 107 | 1.19% | 1,981 | 22.06% | 8,980 |
| DeSoto | 6,211 | 54.79% | 5,026 | 44.34% | 99 | 0.87% | 1,185 | 10.45% | 11,336 |
| East Baton Rouge | 99,943 | 54.42% | 82,298 | 44.81% | 1,401 | 0.76% | 17,645 | 9.61% | 183,642 |
| East Carroll | 1,357 | 39.97% | 1,980 | 58.32% | 58 | 1.71% | -623 | -18.35% | 3,395 |
| East Feliciana | 5,021 | 54.57% | 4,091 | 44.46% | 89 | 0.97% | 930 | 10.11% | 9,201 |
| Evangeline | 7,949 | 56.86% | 5,757 | 41.18% | 273 | 1.95% | 2,192 | 15.68% | 13,979 |
| Franklin | 6,141 | 67.46% | 2,828 | 31.07% | 134 | 1.47% | 3,313 | 36.39% | 9,103 |
| Grant | 5,911 | 73.97% | 1,977 | 24.74% | 103 | 1.29% | 3,934 | 49.23% | 7,991 |
| Iberia | 19,420 | 60.17% | 12,426 | 38.50% | 427 | 1.32% | 6,994 | 21.67% | 32,273 |
| Iberville | 6,333 | 42.71% | 8,259 | 55.70% | 235 | 1.58% | -1,926 | -12.99% | 14,827 |
| Jackson | 5,038 | 65.88% | 2,525 | 33.02% | 84 | 1.10% | 2,513 | 32.86% | 7,647 |
| Jefferson | 117,882 | 61.50% | 72,136 | 37.64% | 1,645 | 0.86% | 45,746 | 23.86% | 191,663 |
| Jefferson Davis | 8,055 | 61.93% | 4,745 | 36.48% | 207 | 1.59% | 3,310 | 25.45% | 13,007 |
| Lafayette | 57,732 | 64.20% | 31,210 | 34.71% | 981 | 1.09% | 26,522 | 29.49% | 89,923 |
| Lafourche | 22,734 | 60.04% | 14,417 | 38.08% | 713 | 1.88% | 8,317 | 21.96% | 37,864 |
| LaSalle | 5,015 | 80.39% | 1,155 | 18.52% | 68 | 1.09% | 3,860 | 61.87% | 6,238 |
| Lincoln | 10,791 | 59.23% | 7,242 | 39.75% | 185 | 1.02% | 3,549 | 19.48% | 18,218 |
| Livingston | 33,976 | 76.78% | 9,895 | 22.36% | 382 | 0.86% | 24,081 | 54.42% | 44,253 |
| Madison | 2,291 | 49.03% | 2,334 | 49.95% | 48 | 1.03% | -43 | -0.92% | 4,673 |
| Morehouse | 7,471 | 57.60% | 5,336 | 41.14% | 164 | 1.26% | 2,135 | 16.46% | 12,971 |
| Natchitoches | 9,261 | 54.59% | 7,398 | 43.60% | 307 | 1.81% | 1,863 | 10.99% | 16,966 |
| Orleans | 42,847 | 21.74% | 152,610 | 77.43% | 1,646 | 0.84% | -109,763 | -55.69% | 197,103 |
| Ouachita | 41,750 | 64.78% | 22,016 | 34.16% | 678 | 1.05% | 19,734 | 30.62% | 64,444 |
| Plaquemines | 7,866 | 64.72% | 4,181 | 34.40% | 106 | 0.87% | 3,685 | 30.32% | 12,153 |
| Pointe Coupee | 5,429 | 48.17% | 5,712 | 50.68% | 130 | 1.15% | -283 | -2.51% | 11,271 |
| Rapides | 34,492 | 63.79% | 18,904 | 34.96% | 673 | 1.24% | 15,588 | 28.83% | 54,069 |
| Red River | 2,507 | 53.15% | 2,140 | 45.37% | 70 | 1.48% | 367 | 7.78% | 4,717 |
| Richland | 5,471 | 63.14% | 3,082 | 35.57% | 112 | 1.29% | 2,389 | 27.57% | 8,665 |
| Sabine | 6,711 | 70.08% | 2,743 | 28.64% | 122 | 1.27% | 3,968 | 41.44% | 9,576 |
| St. Bernard | 19,597 | 65.68% | 9,956 | 33.37% | 285 | 0.96% | 9,641 | 32.31% | 29,838 |
| St. Charles | 14,747 | 61.87% | 8,856 | 37.15% | 234 | 0.98% | 5,891 | 24.72% | 23,837 |
| St. Helena | 2,235 | 40.58% | 3,173 | 57.61% | 100 | 1.82% | -938 | -17.03% | 5,508 |
| St. James | 4,545 | 40.92% | 6,407 | 57.68% | 156 | 1.40% | -1,862 | -16.76% | 11,108 |
| St. John the Baptist | 9,039 | 46.08% | 10,305 | 52.53% | 273 | 1.39% | -1,266 | -6.45% | 19,617 |
| St. Landry | 18,315 | 49.82% | 18,166 | 49.42% | 279 | 0.76% | 149 | 0.40% | 36,760 |
| St. Martin | 12,095 | 52.99% | 10,321 | 45.22% | 408 | 1.79% | 1,774 | 7.77% | 22,824 |
| St. Mary | 12,877 | 56.74% | 9,547 | 42.07% | 270 | 1.19% | 3,330 | 14.67% | 22,694 |
| St. Tammany | 75,139 | 74.70% | 24,665 | 24.52% | 788 | 0.78% | 50,474 | 50.18% | 100,592 |
| Tangipahoa | 26,181 | 62.14% | 15,345 | 36.42% | 609 | 1.45% | 10,836 | 25.72% | 42,135 |
| Tensas | 1,453 | 49.04% | 1,469 | 49.58% | 41 | 1.38% | -16 | -0.54% | 2,963 |
| Terrebonne | 26,358 | 64.96% | 13,684 | 33.73% | 532 | 1.31% | 12,674 | 31.23% | 40,574 |
| Union | 7,457 | 69.57% | 3,089 | 28.82% | 172 | 1.60% | 4,368 | 40.75% | 10,718 |
| Vermilion | 15,069 | 61.38% | 9,085 | 37.00% | 398 | 1.62% | 5,984 | 24.38% | 24,552 |
| Vernon | 11,032 | 72.44% | 4,035 | 26.50% | 162 | 1.06% | 6,997 | 45.94% | 15,229 |
| Washington | 11,006 | 61.69% | 6,554 | 36.74% | 281 | 1.58% | 4,452 | 24.95% | 17,841 |
| Webster | 11,070 | 60.00% | 6,833 | 37.04% | 546 | 2.96% | 4,237 | 22.96% | 18,449 |
| West Baton Rouge | 5,822 | 53.73% | 4,932 | 45.52% | 81 | 0.75% | 890 | 8.21% | 10,835 |
| West Carroll | 3,740 | 74.31% | 1,231 | 24.46% | 62 | 1.23% | 2,509 | 49.85% | 5,033 |
| West Feliciana | 2,932 | 56.19% | 2,214 | 42.43% | 72 | 1.38% | 718 | 13.76% | 5,218 |
| Winn | 4,366 | 67.10% | 2,056 | 31.60% | 85 | 1.31% | 2,310 | 35.50% | 6,507 |
| Totals | 1,102,169 | 56.72% | 820,299 | 42.22% | 20,638 | 1.06% | 281,870 | 14.50% | 1,943,106 |
Parishes that flipped Democratic to Republican
[edit]- Bienville (Largest city: Arcadia)
- Caddo (Largest city: Shreveport)
- St. Landry (Largest city: Opelousas)
- West Baton Rouge (Largest city: Port Allen)
By congressional district
[edit]Bush won six of seven congressional districts, including one held by a Democrat.
| District | Bush | Kerry | Representative |
|---|---|---|---|
| 1st | 71% | 28% | David Vitter |
| Bobby Jindal | |||
| 2nd | 24% | 75% | William J. Jefferson |
| 3rd | 58% | 41% | Billy Tauzin |
| Charlie Melancon | |||
| 4th | 59% | 40% | Jim McCrery |
| 5th | 62% | 37% | Rodney Alexander |
| 6th | 59% | 40% | Richard H. Baker |
| 7th | 70% | 30% | Chris John |
| Charles Boustany |
Electors
[edit]Technically the voters of Louisiana cast their ballots for electors: representatives to the Electoral College. Louisiana is allocated nine electors because it has seven congressional districts and two senators. All candidates who appear on the ballot or qualify to receive write-in votes must submit a list of nine electors, who pledge to vote for their candidate and his or her running mate. Whoever wins the majority of votes in the state is awarded all nine electoral votes. Their chosen electors then vote for president and vice president. Although electors are pledged to their candidate and running mate, they are not obligated to vote for them. An elector who votes for someone other than his or her candidate is known as a faithless elector.
The electors of each state and the District of Columbia met on December 13, 2004, to cast their votes for president and vice president. The Electoral College itself never meets as one body. Instead the electors from each state and the District of Columbia met in their respective capitols.
The following were the members of the Electoral College from the state. All nine were pledged to Bush/Cheney:
- Tom Angers
- Michael Bayham
- David R. Carroll
- Archie Corder
- Floyd Gonzalez
- Gerald Hebert
- John H. Musser
- Sal Palmisano
- Ruth L. Ulrich
See also
[edit]References
[edit]- ^ "Dave Leip's Atlas of U.S. Presidential Elections". uselectionatlas.org. Retrieved April 12, 2023.
- ^ [1] Archived 2016-03-03 at the Wayback Machine
- ^ "Election 2004 Polls - Dave Leip's Atlas of U.S. Presidential Elections". uselectionatlas.org. Archived from the original on July 20, 2012. Retrieved January 26, 2022.
- ^ "George W Bush - $374,659,453 raised, '04 election cycle, Republican Party, President". Campaignmoney.com. Retrieved May 20, 2015.
- ^ "John F Kerry - $345,826,176 raised, '04 election cycle, Democratic Party, President". Campaignmoney.com. Retrieved May 20, 2015.
- ^ "Specials". Cnn.com. Retrieved May 20, 2015.
- ^ "Specials". Cnn.com. Retrieved May 20, 2015.
- ^ a b Sullivan, Robert David; ‘How the Red and Blue Map Evolved Over the Past Century’; America Magazine in The National Catholic Review; June 29, 2016
- ^ "2004 Presidential General Election Results - Louisiana".


