2000 United States presidential election in Arkansas
| ||||||||||||||||||||||||||
| ||||||||||||||||||||||||||
| ||||||||||||||||||||||||||
| ||||||||||||||||||||||||||
| Elections in Arkansas |
|---|
 |
The 2000 United States presidential election in Arkansas took place on November 7, 2000, and was part of the 2000 United States presidential election. State voters chose six representatives, or electors to the Electoral College, who voted for president and vice president.
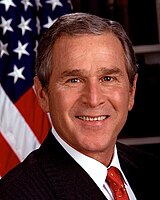
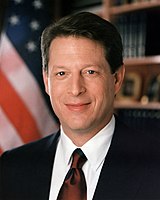
In this election, Arkansas was seen as a swing state, as George W. Bush's opposition to abortion and support for the death penalty, issues that resonated with many Arkansans[1][2] combined with Gore distancing himself from the popularity of Arkansas native and sitting president Bill Clinton created a battleground environment in the state.[3]
In the end, Bush won the state by 5.45%; this represents a hard swing to the right from the 16.94-point Democratic victory four years prior. As of the 2024 presidential election[update], this is the last election in which Ashley County, Craighead County, Cross County, Dallas County, Drew County, Greene County, Hot Spring County, Izard County, Lafayette County, Nevada County, and Ouachita County have voted for the Democratic candidate. This is the last time Democrats won any congressional district in the state.
Results
[edit]| 2000 United States presidential election in Arkansas | |||||
|---|---|---|---|---|---|
| Party | Candidate | Votes | Percentage | Electoral votes | |
| Republican | George W. Bush | 472,940 | 51.31% | 6 | |
| Democratic | Al Gore | 422,768 | 45.86% | 0 | |
| Green Party | Ralph Nader | 13,421 | 1.46% | 0 | |
| Reform | Patrick Buchanan | 5,192 | 0.80% | 0 | |
| Libertarian | Harry Browne | 2,781 | 0.30% | 0 | |
| Constitution Party | Howard Phillips | 1,145 | 0.14% | 0 | |
| Natural Law | John Hagelin | 1,098 | 0.13% | 0 | |
| Totals | 919,345 | 100.00% | 6 | ||
| Voter turnout | 46% | ||||
By county
[edit]| County | George W. Bush Republican |
Al Gore Democratic |
Various candidates Other parties |
Margin | Total | ||||
|---|---|---|---|---|---|---|---|---|---|
| # | % | # | % | # | % | # | % | ||
| Arkansas | 3,353 | 52.62% | 2,877 | 45.15% | 142 | 2.23% | 476 | 7.47% | 6,372 |
| Ashley | 3,876 | 46.86% | 4,253 | 51.42% | 142 | 1.72% | -377 | -4.56% | 8,271 |
| Baxter | 9,538 | 57.09% | 6,516 | 39.00% | 654 | 3.91% | 3,022 | 18.09% | 16,708 |
| Benton | 34,838 | 64.94% | 17,277 | 32.21% | 1,531 | 2.85% | 17,561 | 32.73% | 53,646 |
| Boone | 8,569 | 62.85% | 4,493 | 32.95% | 573 | 4.20% | 4,076 | 29.90% | 13,635 |
| Bradley | 1,793 | 45.06% | 2,122 | 53.33% | 64 | 1.61% | -329 | -8.27% | 3,979 |
| Calhoun | 1,128 | 51.62% | 1,017 | 46.54% | 40 | 1.83% | 111 | 5.08% | 2,185 |
| Carroll | 5,556 | 57.94% | 3,595 | 37.49% | 439 | 4.58% | 1,961 | 20.45% | 9,590 |
| Chicot | 1,564 | 35.13% | 2,820 | 63.34% | 68 | 1.53% | -1,256 | -28.21% | 4,452 |
| Clark | 3,376 | 43.77% | 4,661 | 54.03% | 189 | 2.19% | -1,285 | -10.26% | 8,626 |
| Clay | 2,254 | 38.20% | 3,527 | 59.78% | 119 | 2.02% | -1,273 | -21.58% | 5,900 |
| Cleburne | 5,730 | 56.14% | 4,120 | 40.36% | 357 | 3.50% | 1,610 | 15.78% | 10,207 |
| Cleveland | 1,678 | 52.75% | 1,414 | 44.45% | 89 | 2.80% | 264 | 8.30% | 3,181 |
| Columbia | 5,018 | 53.92% | 4,003 | 43.01% | 286 | 3.07% | 1,015 | 10.91% | 9,307 |
| Conway | 3,545 | 49.00% | 3,496 | 48.33% | 193 | 2.67% | 49 | 0.67% | 7,234 |
| Craighead | 12,158 | 48.33% | 12,376 | 49.20% | 623 | 2.48% | -218 | -0.87% | 25,157 |
| Crawford | 10,804 | 61.30% | 6,288 | 35.68% | 533 | 3.02% | 4,516 | 25.62% | 17,625 |
| Crittenden | 5,857 | 44.26% | 7,224 | 54.59% | 153 | 1.15% | -1,367 | -10.33% | 13,234 |
| Cross | 3,033 | 48.80% | 3,096 | 49.81% | 86 | 1.38% | -63 | -1.01% | 6,215 |
| Dallas | 1,571 | 47.25% | 1,710 | 51.43% | 44 | 1.32% | -139 | -4.18% | 3,325 |
| Desha | 1,603 | 35.66% | 2,776 | 61.76% | 116 | 2.58% | -1,173 | -26.10% | 4,495 |
| Drew | 2,756 | 46.54% | 3,060 | 51.67% | 106 | 1.79% | -304 | -5.13% | 5,922 |
| Faulkner | 16,055 | 54.95% | 11,950 | 40.90% | 1,211 | 4.14% | 4,105 | 14.05% | 29,216 |
| Franklin | 3,277 | 53.37% | 2,674 | 43.55% | 189 | 3.08% | 603 | 9.82% | 6,140 |
| Fulton | 2,036 | 49.56% | 1,976 | 48.10% | 96 | 2.34% | 60 | 1.46% | 4,108 |
| Garland | 19,098 | 53.15% | 15,840 | 44.08% | 997 | 2.77% | 3,258 | 9.07% | 35,935 |
| Grant | 3,285 | 54.63% | 2,535 | 42.16% | 193 | 3.21% | 750 | 12.47% | 6,013 |
| Greene | 5,831 | 46.71% | 6,319 | 50.62% | 334 | 2.68% | -488 | -3.91% | 12,484 |
| Hempstead | 3,257 | 44.68% | 3,937 | 54.01% | 95 | 1.30% | -680 | -9.33% | 7,289 |
| Hot Spring | 5,042 | 45.92% | 5,527 | 50.33% | 412 | 3.75% | -485 | -4.41% | 10,981 |
| Howard | 2,326 | 52.16% | 2,063 | 46.27% | 70 | 1.57% | 263 | 5.89% | 4,459 |
| Independence | 6,145 | 53.00% | 5,146 | 44.39% | 303 | 2.61% | 999 | 8.61% | 11,594 |
| Izard | 2,301 | 45.73% | 2,587 | 51.41% | 144 | 2.86% | -286 | -5.68% | 5,032 |
| Jackson | 2,280 | 37.55% | 3,651 | 60.13% | 141 | 2.32% | -1,371 | -22.58% | 6,072 |
| Jefferson | 8,765 | 32.22% | 17,716 | 65.13% | 720 | 2.65% | -8,951 | -32.91% | 27,201 |
| Johnson | 3,657 | 51.07% | 3,270 | 45.66% | 234 | 3.27% | 387 | 5.41% | 7,161 |
| Lafayette | 1,538 | 45.46% | 1,806 | 53.38% | 39 | 1.15% | -268 | -7.92% | 3,383 |
| Lawrence | 2,626 | 43.48% | 3,255 | 53.89% | 159 | 2.63% | -629 | -10.41% | 6,040 |
| Lee | 1,351 | 32.78% | 2,727 | 66.17% | 43 | 1.04% | -1,376 | -33.39% | 4,121 |
| Lincoln | 1,526 | 43.03% | 1,957 | 55.19% | 63 | 1.78% | -431 | -12.16% | 3,546 |
| Little River | 2,283 | 43.38% | 2,883 | 54.78% | 97 | 1.84% | -600 | -11.40% | 5,263 |
| Logan | 4,487 | 55.42% | 3,283 | 40.55% | 326 | 4.03% | 1,204 | 14.87% | 8,096 |
| Lonoke | 10,606 | 59.11% | 6,851 | 38.18% | 486 | 2.71% | 3,755 | 20.93% | 17,943 |
| Madison | 3,387 | 60.18% | 2,055 | 36.51% | 186 | 3.30% | 1,332 | 23.67% | 5,628 |
| Marion | 3,402 | 56.56% | 2,233 | 37.12% | 380 | 6.32% | 1,169 | 19.44% | 6,015 |
| Miller | 7,276 | 52.94% | 6,278 | 45.67% | 191 | 1.39% | 998 | 7.27% | 13,745 |
| Mississippi | 5,199 | 41.31% | 7,107 | 56.47% | 280 | 2.22% | -1,908 | -15.16% | 12,586 |
| Monroe | 1,329 | 40.36% | 1,910 | 58.00% | 54 | 1.64% | -581 | -17.64% | 3,293 |
| Montgomery | 2,128 | 56.91% | 1,438 | 38.46% | 173 | 4.63% | 690 | 18.45% | 3,739 |
| Nevada | 1,796 | 48.05% | 1,867 | 49.95% | 75 | 2.00% | -71 | -1.90% | 3,738 |
| Newton | 2,529 | 64.40% | 1,205 | 30.69% | 193 | 4.91% | 1,324 | 33.71% | 3,927 |
| Ouachita | 4,739 | 45.59% | 5,464 | 52.56% | 192 | 1.85% | -725 | -6.97% | 10,395 |
| Perry | 2,114 | 52.76% | 1,648 | 41.13% | 245 | 6.11% | 466 | 11.63% | 4,007 |
| Phillips | 3,154 | 33.87% | 6,018 | 64.62% | 141 | 1.51% | -2,864 | -30.75% | 9,313 |
| Pike | 2,275 | 57.29% | 1,604 | 40.39% | 92 | 2.32% | 671 | 16.90% | 3,971 |
| Poinsett | 2,988 | 41.30% | 4,102 | 56.70% | 145 | 2.00% | -1,114 | -15.40% | 7,235 |
| Polk | 4,600 | 63.95% | 2,315 | 32.18% | 278 | 3.86% | 2,285 | 31.77% | 7,193 |
| Pope | 11,244 | 61.04% | 6,669 | 36.20% | 509 | 2.76% | 4,575 | 24.84% | 18,422 |
| Prairie | 1,862 | 53.09% | 1,563 | 44.57% | 82 | 2.34% | 299 | 8.52% | 3,507 |
| Pulaski | 55,866 | 43.94% | 68,320 | 53.73% | 2,965 | 2.33% | -12,454 | -9.79% | 127,151 |
| Randolph | 2,673 | 45.48% | 3,019 | 51.37% | 185 | 3.15% | -346 | -5.89% | 5,877 |
| St. Francis | 3,414 | 40.18% | 4,986 | 58.69% | 96 | 1.13% | -1,572 | -18.51% | 8,496 |
| Saline | 18,617 | 57.48% | 12,700 | 39.21% | 1,074 | 3.32% | 5,917 | 18.27% | 32,391 |
| Scott | 2,399 | 60.26% | 1,444 | 36.27% | 138 | 3.47% | 955 | 23.99% | 3,981 |
| Searcy | 2,610 | 64.32% | 1,229 | 30.29% | 219 | 5.40% | 1,381 | 34.03% | 4,058 |
| Sebastian | 23,483 | 58.48% | 15,555 | 38.73% | 1,121 | 2.79% | 7,928 | 19.75% | 40,159 |
| Sevier | 2,111 | 49.17% | 2,095 | 48.80% | 87 | 2.03% | 16 | 0.37% | 4,293 |
| Sharp | 3,698 | 51.89% | 3,236 | 45.41% | 192 | 2.70% | 462 | 6.48% | 7,126 |
| Stone | 2,623 | 53.97% | 2,043 | 42.04% | 194 | 3.99% | 580 | 11.93% | 4,860 |
| Union | 8,647 | 55.40% | 6,261 | 40.11% | 701 | 4.49% | 2,386 | 15.29% | 15,609 |
| Van Buren | 3,485 | 49.90% | 3,202 | 45.85% | 297 | 4.25% | 283 | 4.05% | 6,984 |
| Washington | 28,231 | 54.86% | 21,425 | 41.64% | 1,803 | 3.50% | 6,806 | 13.22% | 51,459 |
| White | 13,170 | 59.46% | 8,342 | 37.66% | 638 | 2.88% | 4,828 | 21.80% | 22,150 |
| Woodruff | 898 | 33.87% | 1,699 | 64.09% | 54 | 2.04% | -801 | -30.22% | 2,651 |
| Yell | 3,223 | 49.75% | 3,062 | 47.26% | 194 | 2.99% | 161 | 2.49% | 6,479 |
| Totals | 472,940 | 51.31% | 422,768 | 45.86% | 26,073 | 2.83% | 50,172 | 5.45% | 921,781 |
Counties that flipped from Democratic to Republican
[edit]- Arkansas (Largest city: Stuttgart)
- Calhoun (Largest city: Hampton)
- Cleburne (Largest city: Heber Springs)
- Cleveland (Largest city: Rison)
- Columbia (Largest city: Magnolia)
- Conway (Largest city: Morrilton)
- Faulkner (Largest city: Conway)
- Franklin (Largest city: Ozark)
- Fulton (Largest city: Salem)
- Garland (Largest city: Hot Springs)
- Grant (Largest city: Sheridan)
- Howard (Largest city: Nashville)
- Independence (Largest city: Batesville)
- Johnson (Largest city: Clarksville)
- Logan (Largest city: Booneville)
- Lonoke (Largest city: Cabot)
- Madison (Largest city: Huntsville)
- Marion (Largest city: Bull Shoals)
- Miller (Largest city: Texarkana)
- Montgomery (Largest city: Mount Ida)
- Perry (Largest city: Perryville)
- Pike (Largest city: Glenwood)
- Pope (Largest city: Russellville)
- Prairie (Largest city: Des Arc)
- Saline (Largest city: Benton)
- Scott (Largest city: Waldron)
- Sevier (Largest city: De Queen)
- Sharp (Largest city: Cherokee Village)
- Stone (Largest city: Mountain View)
- Union (Largest city: El Dorado)
- Van Buren (Largest city: Clinton)
- Washington (Largest city: Fayetteville)
- White (Largest city: Searcy)
- Yell (Largest city: Dardanelle)
By congressional district
[edit]Bush won 2 of 4 congressional districts, including one held by a Democrat.[4]
| District | Bush | Gore | Representative |
|---|---|---|---|
| 1st | 47% | 50% | Marion Berry |
| 2nd | 49% | 48% | Vic Snyder |
| 3rd | 59% | 37% | Asa Hutchinson |
| John Boozman | |||
| 4th | 47% | 50% | Jay Dickey |
| Mike Ross |
Electors
[edit]Technically the voters of Arkansas cast their ballots for electors: representatives to the Electoral College. Arkansas is allocated 6 electors because it has 4 congressional districts and 2 senators. All candidates who appear on the ballot or qualify to receive write-in votes must submit a list of 6 electors, who pledge to vote for their candidate and his or her running mate. Whoever wins the majority of votes in the state is awarded all 6 electoral votes. Their chosen electors then vote for president and vice president. Although electors are pledged to their candidate and running mate, they are not obligated to vote for them. An elector who votes for someone other than his or her candidate is known as a faithless elector.
The electors of each state and the District of Columbia met on December 18, 2000[5] to cast their votes for president and vice president. The Electoral College itself never meets as one body. Instead the electors from each state and the District of Columbia met in their respective capitols.
The following were the members of the Electoral College from the state. All were pledged to and voted for George W. Bush and Dick Cheney:[6]
- Pat Dodge
- Bud Cummins
- Mildred Homan
- Betsy Thompson
- Kim Hendren
- Sarah Agee
See also
[edit]References
[edit]- ^ "George W. Bush on the Issues". On the Issues. Retrieved January 30, 2021.
- ^ "Executed Offenders". Texas Department of Criminal Justice. October 27, 2006. Archived from the original on November 8, 2006. Retrieved January 30, 2021 – via Wayback Machine.
- ^ Neal, Pat (October 10, 2000). "Clinton's Arkansas in play as presidential battleground state". CNN. Retrieved January 30, 2021.
- ^ 2000 Presidential General Election Results - Arkansas US Election Atlas
- ^ "2000 Post-Election Timeline of Events".
- ^ "President Elect - 2000". Archived from the original on February 12, 2012. Retrieved October 24, 2009.


