Snow
| Snow | |
|---|---|
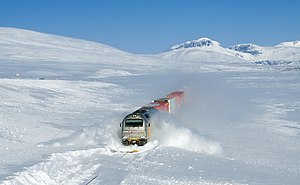 Norwegian train plowing through drifted snow | |
| Physical properties | |
| Density (ρ) | 0.1–0.8 g/cm3 |
| Mechanical properties | |
| Tensile strength (σt) | 1.5–3.5 kPa[1] |
| Compressive strength (σc) | 3–7 MPa[1] |
| Thermal properties | |
| Melting temperature (Tm) | 0 °C |
| Thermal conductivity (k) For densities 0.1 to 0.5 g/cm3 | 0.05–0.7 W/(K·m) |
| Electrical properties | |
| Dielectric constant (εr) For dry snow density 0.1 to 0.9 g/cm3 | 1–3.2 |
| The physical properties of snow vary considerably from event to event, sample to sample, and over time. | |
| Part of a series on |
| Weather |
|---|
|
|
Snow comprises individual ice crystals that grow while suspended in the atmosphere—usually within clouds—and then fall, accumulating on the ground where they undergo further changes.[2] It consists of frozen crystalline water throughout its life cycle, starting when, under suitable conditions, the ice crystals form in the atmosphere, increase to millimeter size, precipitate and accumulate on surfaces, then metamorphose in place, and ultimately melt, slide or sublimate away.
Snowstorms organize and develop by feeding on sources of atmospheric moisture and cold air. Snowflakes nucleate around particles in the atmosphere by attracting supercooled water droplets, which freeze in hexagonal-shaped crystals. Snowflakes take on a variety of shapes, basic among these are platelets, needles, columns and rime. As snow accumulates into a snowpack, it may blow into drifts. Over time, accumulated snow metamorphoses, by sintering, sublimation and freeze-thaw. Where the climate is cold enough for year-to-year accumulation, a glacier may form. Otherwise, snow typically melts seasonally, causing runoff into streams and rivers and recharging groundwater.
Major snow-prone areas include the polar regions, the northernmost half of the Northern Hemisphere and mountainous regions worldwide with sufficient moisture and cold temperatures. In the Southern Hemisphere, snow is confined primarily to mountainous areas, apart from Antarctica.[3]
Snow affects such human activities as transportation: creating the need for keeping roadways, wings, and windows clear; agriculture: providing water to crops and safeguarding livestock; sports such as skiing, snowboarding, and snowmachine travel; and warfare. Snow affects ecosystems, as well, by providing an insulating layer during winter under which plants and animals are able to survive the cold.[1]
Precipitation

Snow develops in clouds that themselves are part of a larger weather system. The physics of snow crystal development in clouds results from a complex set of variables that include moisture content and temperatures. The resulting shapes of the falling and fallen crystals can be classified into a number of basic shapes and combinations thereof. Occasionally, some plate-like, dendritic and stellar-shaped snowflakes can form under clear sky with a very cold temperature inversion present.[4]
Cloud formation
Snow clouds usually occur in the context of larger weather systems, the most important of which is the low-pressure area, which typically incorporate warm and cold fronts as part of their circulation. Two additional and locally productive sources of snow are lake-effect (also sea-effect) storms and elevation effects, especially in mountains.
Low-pressure areas
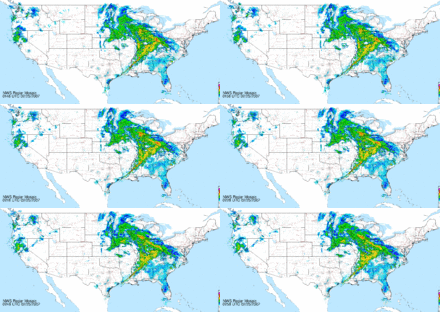
Mid-latitude cyclones are low-pressure areas which are capable of producing anything from cloudiness and mild snow storms to heavy blizzards.[5] During a hemisphere's fall, winter, and spring, the atmosphere over continents can be cold enough through the depth of the troposphere to cause snowfall. In the Northern Hemisphere, the northern side of the low-pressure area produces the most snow.[6] For the southern mid-latitudes, the side of a cyclone that produces the most snow is the southern side.
Fronts
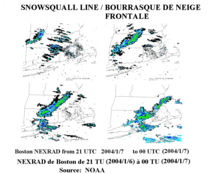
A cold front, the leading edge of a cooler mass of air, can produce frontal snowsqualls—an intense frontal convective line (similar to a rainband), when temperature is near freezing at the surface. The strong convection that develops has enough moisture to produce whiteout conditions at places which the line passes over as the wind causes intense blowing snow.[7] This type of snowsquall generally lasts less than 30 minutes at any point along its path, but the motion of the line can cover large distances. Frontal squalls may form a short distance ahead of the surface cold front or behind the cold front where there may be a deepening low-pressure system or a series of trough lines which act similar to a traditional cold frontal passage. In situations where squalls develop post-frontally, it is not unusual to have two or three linear squall bands pass in rapid succession separated only by 25 miles (40 kilometers), with each passing the same point roughly 30 minutes apart. In cases where there is a large amount of vertical growth and mixing, the squall may develop embedded cumulonimbus clouds resulting in lightning and thunder which is dubbed thundersnow.
A warm front can produce snow for a period as warm, moist air overrides below-freezing air and creates precipitation at the boundary. Often, snow transitions to rain in the warm sector behind the front.[7]
Lake and ocean effects

Lake-effect snow is produced during cooler atmospheric conditions when a cold air mass moves across long expanses of warmer lake water, warming the lower layer of air which picks up water vapor from the lake, rises up through the colder air above, freezes, and is deposited on the leeward (downwind) shores.[8][9]
The same effect occurring over bodies of salt water is termed ocean-effect or bay-effect snow. The effect is enhanced when the moving air mass is uplifted by the orographic influence of higher elevations on the downwind shores. This uplifting can produce narrow but very intense bands of precipitation which may deposit at a rate of many inches of snow each hour, often resulting in a large amount of total snowfall.[10]
The areas affected by lake-effect snow are called snowbelts. These include areas east of the Great Lakes, the west coasts of northern Japan, the Kamchatka Peninsula in Russia, and areas near the Great Salt Lake, Black Sea, Caspian Sea, Baltic Sea, and parts of the northern Atlantic Ocean.[11]
Mountain effects
Orographic or relief snowfall is created when moist air is forced up the windward side of mountain ranges by a large-scale wind flow. The lifting of moist air up the side of a mountain range results in adiabatic cooling, and ultimately condensation and precipitation. Moisture is gradually removed from the air by this process, leaving drier and warmer air on the descending, or leeward, side.[12] The resulting enhanced snowfall,[13] along with the decrease in temperature with elevation,[14] combine to increase snow depth and seasonal persistence of snowpack in snow-prone areas.[1][15]
Mountain waves have also been found to help enhance precipitation amounts downwind of mountain ranges by enhancing the lift needed for condensation and precipitation.[16]
Cloud physics
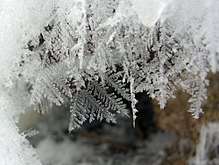
A snowflake consists of roughly 1019 water molecules which are added to its core at different rates and in different patterns depending on the changing temperature and humidity within the atmosphere that the snowflake falls through on its way to the ground. As a result, snowflakes differ from each other though they follow similar patterns.[17][18][19]
Snow crystals form when tiny supercooled cloud droplets (about 10 μm in diameter) freeze. These droplets are able to remain liquid at temperatures lower than −18 °C (0 °F), because to freeze, a few molecules in the droplet need to get together by chance to form an arrangement similar to that in an ice lattice. The droplet freezes around this "nucleus". In warmer clouds, an aerosol particle or "ice nucleus" must be present in (or in contact with) the droplet to act as a nucleus. Ice nuclei are very rare compared to cloud condensation nuclei on which liquid droplets form. Clays, desert dust, and biological particles can be nuclei.[20] Artificial nuclei include particles of silver iodide and dry ice, and these are used to stimulate precipitation in cloud seeding.[21]
Once a droplet has frozen, it grows in the supersaturated environment—one where air is saturated with respect to ice when the temperature is below the freezing point. The droplet then grows by diffusion of water molecules in the air (vapor) onto the ice crystal surface where they are collected. Because water droplets are so much more numerous than the ice crystals, the crystals are able to grow to hundreds of micrometers or millimeters in size at the expense of the water droplets by the Wegener–Bergeron–Findeisen process. These large crystals are an efficient source of precipitation, since they fall through the atmosphere due to their mass, and may collide and stick together in clusters, or aggregates. These aggregates are snowflakes, and are usually the type of ice particle that falls to the ground.[22] Although the ice is clear, scattering of light by the crystal facets and hollows/imperfections mean that the crystals often appear white in color due to diffuse reflection of the whole spectrum of light by the small ice particles.[23]
Classification of snowflakes
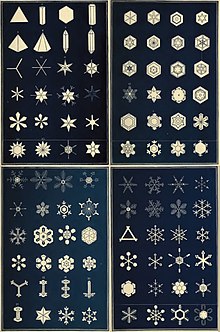
Micrography of thousands of snowflakes from 1885 onward, starting with Wilson Alwyn Bentley, revealed the wide diversity of snowflakes within a classifiable set of patterns.[25] Closely matching snow crystals have been observed.[26]
Ukichiro Nakaya developed a crystal morphology diagram, relating crystal shapes to the temperature and moisture conditions under which they formed, which is summarized in the following table.[1]
| Temperature range | Saturation range | Types of snow crystal | |||
|---|---|---|---|---|---|
| °C | °F | g/m3 | oz/cu yd | below saturation | above saturation |
| 0 to −3.5 | 32 to 26 | 0.0 to 0.5 | 0.000 to 0.013 | Solid plates | Thin plates
Dendrites |
| −3.5 to −10 | 26 to 14 | 0.5 to 1.2 | 0.013 to 0.032 | Solid prisms
Hollow prisms |
Hollow prisms
Needles |
| −10 to −22 | 14 to −8 | 1.2 to 1.4 | 0.032 to 0.038 | Thin plates
Solid plates |
Sectored plates
Dendrites |
| −22 to −40 | −8 to −40 | 1.2 to 0.1 | 0.0324 to 0.0027 | Thin plates
Solid plates |
Columns
Prisms |
Nakaya discovered that the shape is also a function of whether the prevalent moisture is above or below saturation. Forms below the saturation line tend more toward solid and compact while crystals formed in supersaturated air tend more toward lacy, delicate, and ornate. Many more complex growth patterns also form, which include side-planes, bullet-rosettes, and planar types, depending on the conditions and ice nuclei.[27][28][29] If a crystal has started forming in a column growth regime at around −5 °C (23 °F) and then falls into the warmer plate-like regime, plate or dendritic crystals sprout at the end of the column, producing so called "capped columns".[22]
Magono and Lee devised a classification of freshly formed snow crystals that includes 80 distinct shapes. They documented each with micrographs.[30]
Accumulation
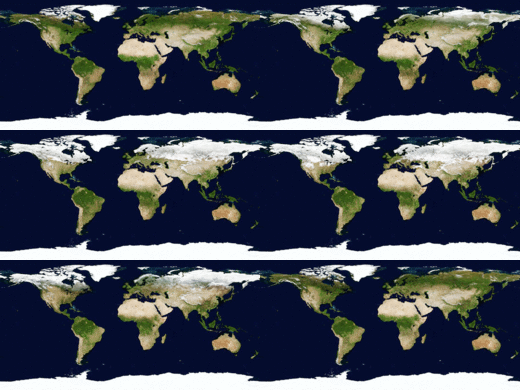
Snow accumulates from a series of snow events, punctuated by freezing and thawing, over areas that are cold enough to retain snow seasonally or perennially. Major snow-prone areas include the Arctic and Antarctic, the Northern Hemisphere, and alpine regions. The liquid equivalent of snowfall may be evaluated using a snow gauge[31] or with a standard rain gauge, adjusted for winter by removal of a funnel and inner cylinder.[32] Both types of gauges melt the accumulated snow and report the amount of water collected.[33] At some automatic weather stations an ultrasonic snow depth sensor may be used to augment the precipitation gauge.[34]
Event

Snow flurry, snow shower, snow storm and blizzard describe snow events of progressively greater duration and intensity.[35] A blizzard is a weather condition involving snow and has varying definitions in different parts of the world. In the United States, a blizzard occurs when two conditions are met for a period of three hours or more: a sustained wind or frequent gusts to 35 miles per hour (16 m/s), and sufficient snow in the air to reduce visibility to less than 0.4 kilometers (0.25 mi).[36] In Canada and the United Kingdom, the criteria are similar.[37][38] While heavy snowfall often occurs during blizzard conditions, falling snow is not a requirement, as blowing snow can create a ground blizzard.[39]
Snowstorm intensity may be categorized by visibility and depth of accumulation.[40] Snowfall's intensity is determined by visibility, as follows:[41]
- Light: visibility greater than 1 kilometer (0.6 mi)
- Moderate: visibility restrictions between 0.5 and 1 kilometer (0.3 and 0.6 mi)
- Heavy: visibility is less than 0.5 kilometers (0.3 mi)
Snowsqualls may deposit snow in bands that extend from bodies of water as lake-event weather or result from the passage of an upper-level front.[42][43][44]
The International Classification for Seasonal Snow on the Ground defines "height of new snow" as the depth of freshly fallen snow, in centimeters as measured with a ruler, that accumulated on a snowboard during an observation period of 24 hours, or other observation interval. After the measurement, the snow is cleared from the board and the board is placed flush with the snow surface to provide an accurate measurement at the end of the next interval.[4] Melting, compacting, blowing and drifting contribute to the difficulty of measuring snowfall.[45]
Distribution

Glaciers with their permanent snowpacks cover about 10% of the earth's surface, while seasonal snow covers about nine percent,[1] mostly in the Northern Hemisphere, where seasonal snow covers about 40 million square kilometres (15×106 sq mi), according to a 1987 estimate.[46] A 2007 estimate of snow cover over the Northern Hemisphere suggested that, on average, snow cover ranges from a minimum extent of 2 million square kilometres (0.77×10⁶ sq mi) each August to a maximum extent of 45 million square kilometres (17×106 sq mi) each January or nearly half of the land surface in that hemisphere.[47][48] A study of Northern Hemisphere snow cover extent for the period 1972–2006 suggests a reduction of 0.5 million square kilometres (0.19×10⁶ sq mi) over the 35-year period.[48]
Records
The following are world records regarding snowfall and snowflakes:
- Highest seasonal total snowfall – The world record for the highest seasonal total snowfall was measured in the United States at Mt. Baker Ski Area, outside of the city of Bellingham, Washington during the 1998–1999 season. Mount Baker received 2,896 cm (95.01 ft) of snow,[49] thus surpassing the previous record holder, Mount Rainier, Washington, which during the 1971–1972 season received 2,850 cm (93.5 ft) of snow.[50]
- Highest seasonal average annual snowfall – The world record for the highest average annual snowfall is 1,764 cm (57.87 ft),[51] measured in Sukayu Onsen, Japan for the period of 1981–2010.
- Largest snowflake – According to Guinness World Records, the world's largest snowflake fell in January 1887 outside present-day Miles City, Montana. It measured 38 cm (15 in) in diameter.[52]
The cities (more than 100,000 inhabitants) with the highest annual snowfall are Aomori (792 cm), Sapporo (485 cm) and Toyama (363 cm) in Japan, followed by St. John's (332 cm) and Quebec City (315 cm) in Canada, and Syracuse, NY (325 cm).[53]
Metamorphism

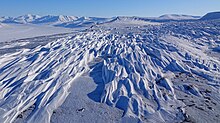
According to the International Association of Cryospheric Sciences, snow metamorphism is "the transformation that the snow undergoes in the period from deposition to either melting or passage to glacial ice".[4] Starting as a powdery deposition, snow becomes more granular when it begins to compact under its own weight, be blown by the wind, sinter particles together and commence the cycle of melting and refreezing. Water vapor plays a role as it deposits ice crystals, known as hoar frost, during cold, still conditions.[54] During this transition, snow "is a highly porous, sintered material made up of a continuous ice structure and a continuously connected pore space, forming together the snow microstructure". Almost always near its melting temperature, a snowpack is continually transforming these properties wherein all three phases of water may coexist, including liquid water partially filling the pore space. After deposition, snow progresses on one of two paths that determine its fate, either by ablation (mostly by melting) from a snow fall or seasonal snowpack, or by transitioning from firn (multi-year snow) into glacier ice.[4]
Seasonal
Over the course of time, a snowpack may settle under its own weight until its density is approximately 30% of water. Increases in density above this initial compression occur primarily by melting and refreezing, caused by temperatures above freezing or by direct solar radiation. In colder climates, snow lies on the ground all winter. By late spring, snow densities typically reach a maximum of 50% of water.[55] Snow that persists into summer evolves into névé, granular snow, which has been partially melted, refrozen and compacted. Névé has a minimum density of 500 kilograms per cubic metre (31 lb/cu ft), which is roughly half of the density of liquid water.[56]
Firn
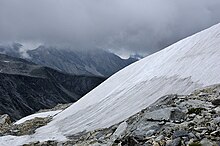
Firn is snow that has persisted for multiple years and has been recrystallized into a substance denser than névé, yet less dense and hard than glacial ice. Firn resembles caked sugar and is very resistant to shovelling. Its density generally ranges from 550 to 830 kilograms per cubic metre (34 to 52 lb/cu ft), and it can often be found underneath the snow that accumulates at the head of a glacier. The minimum altitude that firn accumulates on a glacier is called the firn limit, firn line or snowline.[1][57]
Movement
There are four main mechanisms for movement of deposited snow: drifting of unsintered snow, avalanches of accumulated snow on steep slopes, snowmelt during thaw conditions, and the movement of glaciers after snow has persisted for multiple years and metamorphosed into glacier ice.
Drifting

When powdery snow drifts with the wind from the location where it originally fell,[58] forming deposits with a depth of several meters in isolated locations.[59] After attaching to hillsides, blown snow can evolve into a snow slab, which is an avalanche hazard on steep slopes.[60]
Avalanche

An avalanche (also called a snowslide or snowslip) is a rapid flow of snow down a sloping surface. Avalanches are typically triggered in a starting zone from a mechanical failure in the snowpack (slab avalanche) when the forces on the snow exceed its strength but sometimes only with gradually widening (loose snow avalanche). After initiation, avalanches usually accelerate rapidly and grow in mass and volume as they entrain more snow. If the avalanche moves fast enough some of the snow may mix with the air forming a powder snow avalanche, which is a type of gravity current. They occur in three major mechanisms:[60]
- Slab avalanches occur in snow that has been deposited, or redeposited by wind. They have the characteristic appearance of a block (slab) of snow cut out from its surroundings by fractures. These account for most back-country fatalities.
- Powder snow avalanches result from a deposition of fresh dry powder and generate a powder cloud, which overlies a dense avalanche. They can exceed speeds of 300 kilometers per hour (190 mph), and masses of 10,000,000 tonnes (9,800,000 long tons; 11,000,000 short tons); their flows can travel long distances along flat valley bottoms and even uphill for short distances.
- Wet snow avalanches are a low-velocity suspension of snow and water, with the flow confined to the surface of the pathway.[60] The low speed of travel is due to the friction between the sliding surface of the pathway and the water saturated flow. Despite the low speed of travel (~10 to 40 kilometers per hour (6 to 25 mph)), wet snow avalanches are capable of generating powerful destructive forces, due to the large mass, and density.
Melting
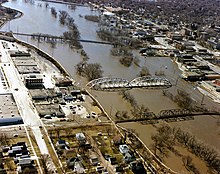
Many rivers originating in mountainous or high-latitude regions receive a significant portion of their flow from snowmelt. This often makes the river's flow highly seasonal resulting in periodic flooding[61] during the spring months and at least in dry mountainous regions like the mountain West of the US or most of Iran and Afghanistan, very low flow for the rest of the year. In contrast, if much of the melt is from glaciated or nearly glaciated areas, the melt continues through the warm season, with peak flows occurring in mid to late summer.[62]
Glaciers
Glaciers form where the accumulation of snow and ice exceeds ablation. The area in which an alpine glacier forms is called a cirque (corrie or cwm), a typically armchair-shaped geological feature, which collects snow and where the snowpack compacts under the weight of successive layers of accumulating snow, forming névé. Further crushing of the individual snow crystals and reduction of entrapped air in the snow turns it into glacial ice. This glacial ice will fill the cirque until it overflows through a geological weakness or an escape route, such as the gap between two mountains. When the mass of snow and ice is sufficiently thick, it begins to move due to a combination of surface slope, gravity and pressure. On steeper slopes, this can occur with as little as 15 m (49 ft) of snow-ice.[1]
Science
Scientists study snow at a wide variety of scales that include the physics of chemical bonds and clouds; the distribution, accumulation, metamorphosis, and ablation of snowpacks; and the contribution of snowmelt to river hydraulics and ground hydrology. In doing so, they employ a variety of instruments to observe and measure the phenomena studied. Their findings contribute to knowledge applied by engineers, who adapt vehicles and structures to snow, by agronomists, who address the availability of snowmelt to agriculture, and those, who design equipment for sporting activities on snow. Scientists develop and others employ snow classification systems that describe its physical properties at scales ranging from the individual crystal to the aggregated snowpack. A sub-specialty is avalanches, which are of concern to engineers and outdoors sports people, alike.
Snow science addresses how snow forms, its distribution, and processes affecting how snowpacks change over time. Scientists improve storm forecasting, study global snow cover and its effect on climate, glaciers, and water supplies around the world. The study includes physical properties of the material as it changes, bulk properties of in-place snow packs, and the aggregate properties of regions with snow cover. In doing so, they employ on-the-ground physical measurement techniques to establish ground truth and remote sensing techniques to develop understanding of snow-related processes over large areas.[63]
Measurement and classification
In the field snow scientists often excavate a snow pit within which to make basic measurements and observations. Observations can describe features caused by wind, water percolation, or snow unloading from trees. Water percolation into a snowpack can create flow fingers and ponding or flow along capillary barriers, which can refreeze into horizontal and vertical solid ice formations within the snowpack. Among the measurements of the properties of snowpacks that the International Classification for Seasonal Snow on the Ground includes are: snow height, snow water equivalent, snow strength, and extent of snow cover. Each has a designation with code and detailed description. The classification extends the prior classifications of Nakaya and his successors to related types of precipitation and are quoted in the following table:[4]

| Subclass | Shape | Physical process |
|---|---|---|
| Graupel | Heavily rimed particles, spherical, conical, hexagonal or irregular in shape | Heavy riming of particles by accretion of supercooled water droplets |
| Hail | Laminar internal structure, translucent or milky glazed surface | Growth by accretion of supercooled water, size: >5 mm |
| Ice pellets | Transparent, mostly small spheroids | Freezing of raindrops or refreezing of largely melted snow crystals or snowflakes (sleet). Graupel or snow pellets encased in thin ice layer (small hail). Size: both 5 mm |
| Rime | Irregular deposits or longer cones and needles pointing into the wind | Accretion of small, supercooled fog droplets frozen in place. Thin breakable crust forms on snow surface if process continues long enough. |
All are formed in cloud, except for rime, which forms on objects exposed to supercooled moisture.
It also has a more extensive classification of deposited snow than those that pertain to airborne snow. The categories include both natural and man-made snow types, descriptions of snow crystals as they metamorphose and melt, the development of hoar frost in the snow pack and the formation of ice therein. Each such layer of a snowpack differs from the adjacent layers by one or more characteristics that describe its microstructure or density, which together define the snow type, and other physical properties. Thus, at any one time, the type and state of the snow forming a layer have to be defined because its physical and mechanical properties depend on them. Physical properties include microstructure, grain size and shape, snow density, liquid water content, and temperature.[4]
When it comes to measuring snow cover on the ground, typically three variables are measured: the snow cover extent (SCE) — the land area covered by snow, snow cover duration (SD) — how long a particular area is covered by snow, and the snow accumulation, often expressed as snow water equivalent (SWE), which expresses how much water the snow would be if it were all melted: this last one is a measurement of the volume of the snowpack.[64] To measure these variables a variety of techniques are used: surface observations, remote sensing, land surface models and reanalysis products. These techniques are often combined to form the most complete datasets.[64]
Satellite data
Remote sensing of snowpacks with satellites and other platforms typically includes multi-spectral collection of imagery.[65] Multi-faceted interpretation of the data obtained allows inferences about what is observed. The science behind these remote observations has been verified with ground-truth studies of the actual conditions.[1][66]
Satellite observations record a decrease in snow-covered areas since the 1960s, when satellite observations began. In some regions such as China, a trend of increasing snow cover was observed from 1978 to 2006. These changes are attributed to global climate change, which may lead to earlier melting and less coverage area. In some areas, snow depth increases because of higher temperatures in latitudes north of 40°. For the Northern Hemisphere as a whole the mean monthly snow-cover extent has been decreasing by 1.3% per decade.[67]
The most frequently used methods to map and measure snow extent, snow depth and snow water equivalent employ multiple inputs on the visible–infrared spectrum to deduce the presence and properties of snow. The National Snow and Ice Data Center (NSIDC) uses the reflectance of visible and infrared radiation to calculate a normalized difference snow index, which is a ratio of radiation parameters that can distinguish between clouds and snow. Other researchers have developed decision trees, employing the available data to make more accurate assessments. One challenge to this assessment is where snow cover is patchy, for example during periods of accumulation or ablation and also in forested areas. Cloud cover inhibits optical sensing of surface reflectance, which has led to other methods for estimating ground conditions underneath clouds. For hydrological models, it is important to have continuous information about the snow cover. Passive microwave sensors are especially valuable for temporal and spatial continuity because they can map the surface beneath clouds and in darkness. When combined with reflective measurements, passive microwave sensing greatly extends the inferences possible about the snowpack.[67]
Satellite measurements show that snow cover has been decreasing in many areas of the world since 1978.[64]
Models

Snow science often leads to predictive models that include snow deposition, snow melt, and snow hydrology—elements of the Earth's water cycle—which help describe global climate change.[1]
Global climate change models (GCMs) incorporate snow as a factor in their calculations. Some important aspects of snow cover include its albedo (reflectivity of incident radiation, including light) and insulating qualities, which slow the rate of seasonal melting of sea ice. As of 2011, the melt phase of GCM snow models were thought to perform poorly in regions with complex factors that regulate snow melt, such as vegetation cover and terrain. These models typically derive snow water equivalent (SWE) in some manner from satellite observations of snow cover.[1] The International Classification for Seasonal Snow on the Ground defines SWE as "the depth of water that would result if the mass of snow melted completely".[4]
Given the importance of snowmelt to agriculture, hydrological runoff models that include snow in their predictions address the phases of accumulating snowpack, melting processes, and distribution of the meltwater through stream networks and into the groundwater. Key to describing the melting processes are solar heat flux, ambient temperature, wind, and precipitation. Initial snowmelt models used a degree-day approach that emphasized the temperature difference between the air and the snowpack to compute snow water equivalent, SWE. More recent models use an energy balance approach that take into account the following factors to compute Qm, the energy available for melt. This requires measurement of an array of snowpack and environmental factors to compute six heat flow mechanisms that contribute to Qm.[1]
Effects on civilization
Snow routinely affects civilization in four major areas, transportation, agriculture, structures, and sports. Most transportation modes are impeded by snow on the travel surface. Agriculture often relies on snow as a source of seasonal moisture. Structures may fail under snow loads. Humans find a wide variety of recreational activities in snowy landscapes. It also affects the conduct of warfare.
Transportation
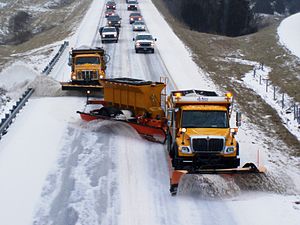
Snow affects the rights of way of highways, airfields and railroads. The snowplow is common to all workers, though roadways take anti-icing chemicals to prevent bonding of ice and airfields may not; railroads rely on abrasives for track traction.
Highway


In the late 20th century, an estimated $2 billion was spent annually in North America on roadway winter maintenance, owing to snow and other winter weather events, according to a 1994 report by Kuemmel. The study surveyed the practices of jurisdictions within 44 US states and nine Canadian provinces. It assessed the policies, practices, and equipment used for winter maintenance. It found similar practices and progress to be prevalent in Europe.[68]
The dominant effect of snow on vehicle contact with the road is diminished friction. This can be improved with the use of snow tires, which have a tread designed to compact snow in a manner that enhances traction. The key to maintaining a roadway that can accommodate traffic during and after a snow event is an effective anti-icing program that employs both chemicals and plowing.[68] The Federal Highway Administration Manual of Practice for an Effective Anti-icing Program emphasizes "anti-icing" procedures that prevent the bonding of snow and ice to the road. Key aspects of the practice include: understanding anti-icing in light of the level of service to be achieved on a given roadway, the climatic conditions to be encountered, and the different roles of deicing, anti-icing, and abrasive materials and applications, and employing anti-icing "toolboxes", one for operations, one for decision-making and another for personnel. The elements to the toolboxes are:[69]
- Operations – Addresses the application of solid and liquid chemicals, using various techniques, including prewetting of chloride-salts. It also addresses plowing capability, including types of snowplows and blades used.
- Decision-making – Combines weather forecast information with road information to assess the upcoming needs for application of assets and the evaluation of treatment effectiveness with operations underway.
- Personnel – Addresses training and deployment of staff to effectively execute the anti-icing program, using the appropriate materials, equipment and procedures.
The manual offers matrices that address different types of snow and the rate of snowfall to tailor applications appropriately and efficiently.
Snow fences, constructed upwind of roadways control snow drifting by causing windblown, drifting snow to accumulate in a desired place. They are also used on railways. Additionally, farmers and ranchers use snow fences to create drifts in basins for a ready supply of water in the spring.[70][71]
Aviation
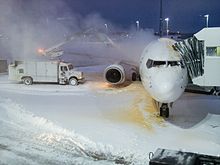
In order to keep airports open during winter storms, runways and taxiways require snow removal. Unlike roadways, where chloride chemical treatment is common to prevent snow from bonding to the pavement surface, such chemicals are typically banned from airports because of their strong corrosive effect on aluminum aircraft. Consequently, mechanical brushes are often used to complement the action of snow plows. Given the width of runways on airfields that handle large aircraft, vehicles with large plow blades, an echelon of plow vehicles or rotary snowplows are used to clear snow on runways and taxiways. Terminal aprons may require 6 hectares (15 acres) or more to be cleared.[72]
Properly equipped aircraft are able to fly through snowstorms under instrument flight rules. Prior to takeoff, during snowstorms they require deicing fluid to prevent accumulation and freezing of snow and other precipitation on wings and fuselages, which may compromise the safety of the aircraft and its occupants.[73] In flight, aircraft rely on a variety of mechanisms to avoid rime and other types of icing in clouds,[74] these include pulsing pneumatic boots, electro-thermal areas that generate heat, and fluid deicers that bleed onto the surface.[75]
Rail
Railroads have traditionally employed two types of snow plows for clearing track, the wedge plow, which casts snow to both sides, and the rotary snowplow, which is suited for addressing heavy snowfall and casting snow far to one side or the other. Prior to the invention of the rotary snowplow ca. 1865, it required multiple locomotives to drive a wedge plow through deep snow. Subsequent to clearing the track with such plows, a "flanger" is used to clear snow from between the rails that are below the reach of the other types of plow. Where icing may affect the steel-to-steel contact of locomotive wheels on track, abrasives (typically sand) have been used to provide traction on steeper uphills.[76]
Railroads employ snow sheds—structures that cover the track—to prevent the accumulation of heavy snow or avalanches to cover tracks in snowy mountainous areas, such as the Alps and the Rocky Mountains.[77]
- Snowplows for different transportation modes
-
Trucks plowing snow on a highway in Missouri
-
Airport snow-clearing operations include plowing and brushing
-
Swiss low-profile, train-mounted snowplow
Construction
Snow can be compacted to form a snow road and be part of a winter road route for vehicles to access isolated communities or construction projects during the winter.[78] Snow can also be used to provide the supporting structure and surface for a runway, as with the Phoenix Airfield in Antarctica. The snow-compacted runway is designed to withstand approximately 60 wheeled flights of heavy-lift military aircraft a year.[79]
Agriculture
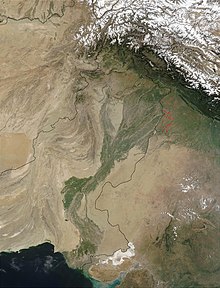
Snowfall can be beneficial to agriculture by serving as a thermal insulator, conserving the heat of the Earth and protecting crops from subfreezing weather. Some agricultural areas depend on an accumulation of snow during winter that will melt gradually in spring, providing water for crop growth, both directly and via runoff through streams and rivers, which supply irrigation canals.[1] The following are examples of rivers that rely on meltwater from glaciers or seasonal snowpack as an important part of their flow on which irrigation depends: the Ganges, many of whose tributaries rise in the Himalayas and which provide much irrigation in northeast India,[80] the Indus River, which rises in Tibet[81] and provides irrigation water to Pakistan from rapidly retreating Tibetan glaciers,[82] and the Colorado River, which receives much of its water from seasonal snowpack in the Rocky Mountains[83] and provides irrigation water to some 4 million acres (1.6 million hectares).[84]
Structures

Snow is an important consideration for loads on structures. To address these, European countries employ Eurocode 1: Actions on structures - Part 1-3: General actions - Snow loads.[85] In North America, ASCE Minimum Design Loads for Buildings and Other Structures gives guidance on snow loads.[86] Both standards employ methods that translate maximum expected ground snow loads onto design loads for roofs.
Roofs
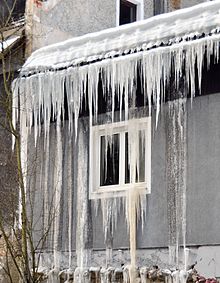
Snow loads and icings are two principal issues for roofs. Snow loads are related to the climate in which a structure is sited. Icings are usually a result of the building or structure generating heat that melts the snow that is on it.
Snow loads – The Minimum Design Loads for Buildings and Other Structures gives guidance on how to translate the following factors into roof snow loads:[86]
- Ground snow loads
- Exposure of the roof
- Thermal properties of the roof
- Shape of the roof
- Drifting
- Importance of the building
It gives tables for ground snow loads by region and a methodology for computing ground snow loads that may vary with elevation from nearby, measured values. The Eurocode 1 uses similar methodologies, starting with ground snow loads that are tabulated for portions of Europe.[85]
Icings – Roofs must also be designed to avoid ice dams, which result from meltwater running under the snow on the roof and freezing at the eave. Ice dams on roofs form when accumulated snow on a sloping roof melts and flows down the roof, under the insulating blanket of snow, until it reaches below freezing temperature air, typically at the eaves. When the meltwater reaches the freezing air, ice accumulates, forming a dam, and snow that melts later cannot drain properly through the dam.[87] Ice dams may result in damaged building materials or in damage or injury when the ice dam falls off or from attempts to remove ice dams. The melting results from heat passing through the roof under the highly insulating layer of snow.[88][89]
Utility lines
In areas with trees, utility distribution lines on poles are less susceptible to snow loads than they are subject to damage from trees falling on them, felled by heavy, wet snow.[90] Elsewhere, snow can accrete on power lines as "sleeves" of rime ice. Engineers design for such loads, which are measured in kg/m (lb/ft) and power companies have forecasting systems that anticipate types of weather that may cause such accretions. Rime ice may be removed manually or by creating a sufficient short circuit in the affected segment of power lines to melt the accretions.[91][92]
Sports and recreation

Snow figures into many winter sports and forms of recreation, including skiing and sledding. Common examples include cross-country skiing, Alpine skiing, snowboarding, snowshoeing, and snowmobiling. The design of the equipment used, e.g. skis and snowboards, typically relies on the bearing strength of snow and contends with the coefficient of friction bearing on snow.
Skiing is by far the largest form of winter recreation. As of 1994, of the estimated 65–75 million skiers worldwide, there were approximately 55 million who engaged in Alpine skiing, the rest engaged in cross-country skiing. Approximately 30 million skiers (of all kinds) were in Europe, 15 million in the US, and 14 million in Japan. As of 1996, there were reportedly 4,500 ski areas, operating 26,000 ski lifts and enjoying 390 million skier visits per year. The preponderant region for downhill skiing was Europe, followed by Japan and the US.[93]
Increasingly, ski resorts are relying on snowmaking, the production of snow by forcing water and pressurized air through a snow gun on ski slopes.[94] Snowmaking is mainly used to supplement natural snow at ski resorts.[95] This allows them to improve the reliability of their snow cover and to extend their ski seasons from late autumn to early spring. The production of snow requires low temperatures. The threshold temperature for snowmaking increases as humidity decreases. Wet-bulb temperature is used as a metric since it takes air temperature and relative humidity into account. Snowmaking is a relatively expensive process in its energy consumption, thereby limiting its use.[96]
Ski wax enhances the ability of a ski (or other runner) to slide over snow by reducing its coefficient of friction, which depends on both the properties of the snow and the ski to result in an optimum amount of lubrication from melting the snow by friction with the ski—too little and the ski interacts with solid snow crystals, too much and capillary attraction of meltwater retards the ski. Before a ski can slide, it must overcome the maximum value static friction. Kinetic (or dynamic) friction occurs when the ski is moving over the snow.[97]
Warfare
Snow affects warfare conducted in winter, alpine environments or at high latitudes. The main factors are impaired visibility for acquiring targets during falling snow, enhanced visibility of targets against snowy backgrounds for targeting, and mobility for both mechanized and infantry troops. Snowfall can severely inhibit the logistics of supplying troops, as well. Snow can also provide cover and fortification against small-arms fire.[98] Noted winter warfare campaigns where snow and other factors affected the operations include:
- The French invasion of Russia, where poor traction conditions for ill-shod horses made it difficult for supply wagons to keep up with troops.[99] That campaign was also strongly affected by cold, whereby the retreating army reached Neman River in December 1812 with only 10,000 of the 420,000 that had set out to invade Russia in June of the same year.[100]
- The Winter War, an attempt by the Soviet Union to take territory in Finland in late 1939 demonstrated superior winter tactics of the Finnish Army, regarding over-snow mobility, camouflage, and use of the terrain.[101]
- The Battle of the Bulge, a German counteroffensive during World War II, starting December 16, 1944, was marked by heavy snowstorms that hampered allied air support for ground troops, but also impaired German attempts to supply their front lines.[102] On the Eastern Front with the Nazi invasion of Russia in 1941, Operation Barbarossa, both Russian and German soldiers had to endure terrible conditions during the Russian winter. While use of ski infantry was common in the Red Army, Germany formed only one division for movement on skis.[101]
- The Korean War which lasted from June 25, 1950, until an armistice on July 27, 1953, began when North Korea invaded South Korea. Much of the fighting occurred during winter conditions, involving snow,[103] notably during the Battle of Chosin Reservoir, which was a stark example of cold affecting military operations, especially vehicles and weapons.[104]
- Military operations in snow
-
Finnish ski troops during the invasion of Finland by the Soviet Union
-
Army vehicles coping with snow during the Battle of the Bulge of World War II
-
Norwegian military preparations during the 2009 Cold Response exercise
Effects on plants and animals
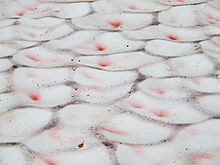
Plants and animals endemic to snowbound areas develop ways to adapt. Among the adaptive mechanisms for plants are freeze-adaptive chemistry,[105] dormancy, seasonal dieback, survival of seeds; and for animals are hibernation, insulation, anti-freeze chemistry, storing food, drawing on reserves from within the body, and clustering for mutual heat.[106]
Snow interacts with vegetation in two principal ways, vegetation can influence the deposition and retention of snow and, conversely, the presence of snow can affect the distribution and growth of vegetation. Tree branches, especially of conifers intercept falling snow and prevent accumulation on the ground. Snow suspended in trees ablates more rapidly than that on the ground, owing to its greater exposure to sun and air movement. Trees and other plants can also promote snow retention on the ground, which would otherwise be blown elsewhere or melted by the sun. Snow affects vegetation in several ways, the presence of stored water can promote growth, yet the annual onset of growth is dependent on the departure of the snowpack for those plants that are buried beneath it. Furthermore, avalanches and erosion from snowmelt can scour terrain of vegetation.[1]
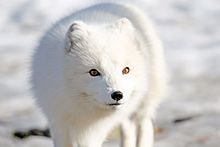
Snow supports a wide variety of animals both on the surface and beneath. Many invertebrates thrive in snow, including spiders, wasps, beetles, snow scorpionflies and springtails. Such arthropods are typically active at temperatures down to −5 °C (23 °F). Invertebrates fall into two groups, regarding surviving subfreezing temperatures: freezing resistant and those that avoid freezing because they are freeze-sensitive. The first group may be cold hardy owing to the ability to produce antifreeze agents in their body fluids that allows survival of long exposure to sub-freezing conditions. Some organisms fast during the winter, which expels freezing-sensitive contents from their digestive tracts. The ability to survive the absence of oxygen in ice is an additional survival mechanism.[106]
Small vertebrates are active beneath the snow. Among vertebrates, alpine salamanders are active in snow at temperatures as low as −8 °C (18 °F); they burrow to the surface in springtime and lay their eggs in melt ponds. Among mammals, those that remain active are typically smaller than 250 grams (8.8 oz). Omnivores are more likely to enter a torpor or be hibernators, whereas herbivores are more likely to maintain food caches beneath the snow. Voles store up to 3 kilograms (6.6 lb) of food and pikas up to 20 kilograms (44 lb). Voles also huddle in communal nests to benefit from one another's warmth. On the surface, wolves, coyotes, foxes, lynx, and weasels rely on these subsurface dwellers for food and often dive into the snowpack to find them.[106]
Outside of Earth
Extraterrestrial "snow" includes water-based precipitation, but also precipitation of other compounds prevalent on other planets and moons in the Solar System. Examples are:
- On Mars, observations of the Phoenix Mars lander revealed that water-based snow crystals occur at high latitudes.[107] Additionally, carbon dioxide precipitates from clouds during the Martian winters at the poles and contributes to a seasonal deposit of that compound, which is the principal component of that planet's ice caps.[108]
- On Venus, observations from the Magellan spacecraft revealed the presence a metallic substance, which precipitates as "Venus snow" and leaves a highly reflective substance at the tops of Venus's highest mountain peaks resembling terrestrial snow. Given the high temperatures on Venus, the leading candidates for the precipitate are lead sulfide and bismuth(III) sulfide.[109]
- On Saturn's moon, Titan, Cassini–Huygens spacecraft observations suggested the presence of methane or some other form of hydrocarbon-based crystalline deposits.[110]
- On Pluto, New Horizons' observations showed that methane condenses at high altitude and falls down as frost.[111]
See also
Lexicon
Notable snow events
- 2007 Siberian orange snow
- Alberta clipper
- List of blizzards
- List of snowiest places in the United States by state
Recreation
Related concepts
Science and scientists
Snow structures
References
- ^ a b c d e f g h i j k l m n Michael P. Bishop; Helgi Björnsson; Wilfried Haeberli; Johannes Oerlemans; John F. Shroder; Martyn Tranter (2011), Singh, Vijay P.; Singh, Pratap; Haritashya, Umesh K. (eds.), Encyclopedia of Snow, Ice and Glaciers, Springer Science & Business Media, p. 1253, ISBN 978-90-481-2641-5
- ^ Hobbs, Peter V. (2010). Ice Physics. Oxford: Oxford University Press. p. 856. ISBN 978-0199587711.
- ^ Rees, W. Gareth (2005). Remote Sensing of Snow and Ice. CRC Press. p. 312. ISBN 978-1-4200-2374-9.
- ^ a b c d e f g Fierz, C.; Armstrong, R.L.; Durand, Y.; Etchevers, P.; Greene, E.; et al. (2009), The International Classification for Seasonal Snow on the Ground (PDF), IHP-VII Technical Documents in Hydrology, vol. 83, Paris: UNESCO, p. 80, archived (PDF) from the original on September 29, 2016, retrieved November 25, 2016
- ^ DeCaria (December 7, 2005). "ESCI 241 – Meteorology; Lesson 16 – Extratropical Cyclones". Department of Earth Sciences, Millersville University. Archived from the original on February 8, 2008. Retrieved June 21, 2009.
- ^ Tolme, Paul (December 2004). "Weather 101: How to track and bag the big storms". Ski Magazine. 69 (4): 126. ISSN 0037-6159.
- ^ a b Meteorological Service of Canada (September 8, 2010). "Snow". Winter Hazards. Environment Canada. Archived from the original on June 11, 2011. Retrieved October 4, 2010.
- ^ "NOAA - National Oceanic and Atmospheric Administration - Monitoring & Understanding Our Changing Planet". Archived from the original on January 2, 2015.
- ^ "Fetch". Archived from the original on May 15, 2008.
- ^ Mass, Cliff (2008). The Weather of the Pacific Northwest. University of Washington Press. p. 60. ISBN 978-0-295-98847-4.
- ^ Thomas W. Schmidlin. Climatic Summary of Snowfall and Snow Depth in the Ohio Snowbelt at Chardon. Archived April 8, 2008, at the Wayback Machine Retrieved on March 1, 2008.
- ^ Physical Geography. CHAPTER 8: Introduction to the Hydrosphere (e). Cloud Formation Processes. Archived December 20, 2008, at the Wayback Machine Retrieved on January 1, 2009.
- ^ Stoelinga, Mark T.; Stewart, Ronald E.; Thompson, Gregory; Theriault, Julie M. (2012), "Micrographic processes within winter orographic cloud and precipitation systems", in Chow, Fotini K.; et al. (eds.), Mountain Weather Research and Forecasting: Recent Progress and Current Challenges, Springer Atmospheric Sciences, Springer Science & Business Media, p. 3, Bibcode:2013mwrf.book.....C, ISBN 978-94-007-4098-3
- ^ Mark Zachary Jacobson (2005). Fundamentals of Atmospheric Modeling (2nd ed.). Cambridge University Press. ISBN 978-0-521-83970-9.
- ^ P., Singh (2001). Snow and Glacier Hydrology. Water Science and Technology Library. Vol. 37. Springer Science & Business Media. p. 75. ISBN 978-0-7923-6767-3.
- ^ Gaffin, David M.; Parker, Stephen S.; Kirkwood, Paul D. (2003). "An Unexpectedly Heavy and Complex Snowfall Event across the Southern Appalachian Region". Weather and Forecasting. 18 (2): 224–235. Bibcode:2003WtFor..18..224G. doi:10.1175/1520-0434(2003)018<0224:AUHACS>2.0.CO;2.
- ^ John Roach (February 13, 2007). ""No Two Snowflakes the Same" Likely True, Research Reveals". National Geographic News. Archived from the original on January 9, 2010. Retrieved July 14, 2009.
- ^ Jon Nelson (September 26, 2008). "Origin of diversity in falling snow". Atmospheric Chemistry and Physics. 8 (18): 5669–5682. Bibcode:2008ACP.....8.5669N. doi:10.5194/acp-8-5669-2008.
- ^ Kenneth Libbrecht (Winter 2004–2005). "Snowflake Science" (PDF). American Educator. Archived from the original (PDF) on November 28, 2008. Retrieved July 14, 2009.
- ^ Brent Q Christner; Cindy E Morris; Christine M Foreman; Rongman Cai; David C Sands (2008). "Ubiquity of Biological Ice Nucleators in Snowfall". Science. 319 (5867): 1214. Bibcode:2008Sci...319.1214C. CiteSeerX 10.1.1.395.4918. doi:10.1126/science.1149757. PMID 18309078. S2CID 39398426.
- ^ Glossary of Meteorology (2009). "Cloud seeding". American Meteorological Society. Archived from the original on March 15, 2012. Retrieved June 28, 2009.
- ^ a b M. Klesius (2007). "The Mystery of Snowflakes". National Geographic. 211 (1): 20. ISSN 0027-9358.
- ^ Jennifer E. Lawson (2001). Hands-on Science: Light, Physical Science (matter) – Chapter 5: The Colors of Light. Portage & Main Press. p. 39. ISBN 978-1-894110-63-1. Retrieved June 28, 2009.
- ^ Warren, Israel Perkins (1863). Snowflakes: a chapter from the book of nature. Boston: American Tract Society. p. 164. Archived from the original on September 9, 2016. Retrieved November 25, 2016.
- ^ Chris V. Thangham (December 7, 2008). "No two snowflakes are alike". Digital Journal. Archived from the original on December 28, 2009. Retrieved July 14, 2009.
- ^ Randolph E. Schmid (June 15, 1988). "Identical snowflakes cause flurry". The Boston Globe. Associated Press. Archived from the original on June 24, 2011. Retrieved November 27, 2008.
But there the two crystals were, side by side, on a glass slide exposed in a cloud on a research flight over Wausau, Wis.
- ^ Matthew Bailey; John Hallett (2004). "Growth rates and habits of ice crystals between −20 and −70C". Journal of the Atmospheric Sciences. 61 (5): 514–544. Bibcode:2004JAtS...61..514B. doi:10.1175/1520-0469(2004)061<0514:GRAHOI>2.0.CO;2.
- ^ Kenneth G. Libbrecht (October 23, 2006). "A Snowflake Primer". California Institute of Technology. Archived from the original on July 10, 2009. Retrieved June 28, 2009.
- ^ Kenneth G. Libbrecht (January–February 2007). "The Formation of Snow Crystals". American Scientist. 95 (1): 52–59. doi:10.1511/2007.63.52.
- ^ Magono, Choji; Lee, Chung Woo (1966), "Meteorological Classification of Natural Snow Crystals", Journal of the Faculty of Science, 7, 3 (4) (Geophysics ed.), Hokkaido: 321–335, hdl:2115/8672
- ^ "Nipher Snow Gauge". On.ec.gc.ca. August 27, 2007. Archived from the original on September 28, 2011. Retrieved August 16, 2011.
- ^ National Weather Service Office, Northern Indiana (April 13, 2009). "8 Inch Non-Recording Standard Rain Gage". National Weather Service Central Region Headquarters. Archived from the original on December 25, 2008. Retrieved January 2, 2009.
- ^ National Weather Service Office Binghamton, New York (2009). Raingauge Information. Archived October 13, 2008, at the Wayback Machine Retrieved on January 2, 2009.
- ^ "All-Weather Precipitation Gauge". On.ec.gc.ca. August 27, 2007. Archived from the original on September 28, 2011. Retrieved August 16, 2011.
- ^ Glossary of Meteorology (2009). "Snow flurry". American Meteorological Society. Archived from the original on November 27, 2007. Retrieved June 28, 2009.
- ^ "National Weather Service Glossary". National Weather Service. 2009. Archived from the original on May 9, 2009. Retrieved July 12, 2009.
- ^ "Blizzards". Winter Severe Weather. Environment Canada. September 4, 2002. Archived from the original on February 11, 2009. Retrieved July 12, 2009.
- ^ Met Office (November 19, 2008). "Key to flash warning criteria". Archived from the original on December 29, 2010. Retrieved July 12, 2009.
- ^ National Weather Service Forecast Office, Flagstaff, Arizona (May 24, 2007). "Blizzards". National Weather Service Western Region Headquarters. Archived from the original on January 15, 2009. Retrieved July 12, 2009.
{{cite web}}: CS1 maint: multiple names: authors list (link) - ^ National Oceanic and Atmospheric Administration (November 1991). "Winter Storms...the Deceptive Killers". United States Department of Commerce. Archived from the original on June 8, 2009. Retrieved June 28, 2009.
- ^ Glossary of Meteorology (2009). "Snow". American Meteorological Society. Archived from the original on February 20, 2009. Retrieved June 28, 2009.
- ^ "NASA's storm-chasing planes fly through blizzards to improve snowfall forecasts". Popular Science. February 3, 2022. Retrieved March 9, 2023.
- ^ NOAA. "What causes bands of heavy snowfall?". weather.gov. US Department of Commerce. Retrieved March 9, 2023.
- ^ Coombs, Mitchel (November 28, 2022). "3D Weather: Science of snow bands". KECI. Retrieved March 9, 2023.
- ^ National Weather Service Forecast Office Northern Indiana (October 2004). "Snow Measurement Guidelines for National Weather Service Snow Spotters" (PDF). National Weather ServiceCentral Region Headquarters. Archived (PDF) from the original on February 15, 2010.
- ^ Chang, A.T.C.; Foster, J.L.; Hall, D.K. (1987). "NIMBUS-7 SMMR derived global snow parameters". Annals of Glaciology. 9: 39–44. doi:10.1017/S0260305500200736.
- ^ Lemke, P.; et al. (2007), "Observations: Changes in snow, ice and frozen ground", in Solomon, S.; et al. (eds.), Climate Change 2007: The Physical Science Basis, New York: Cambridge Univ. Press, pp. 337–383
- ^ a b Déry, S. J; Brown, R. D. (2007), "Recent Northern Hemisphere snow cover extent trends and implications for the snow-albedo feedback", Geophysical Research Letters, 34 (L22504): L22504, Bibcode:2007GeoRL..3422504D, doi:10.1029/2007GL031474
- ^ "NOAA: Mt. Baker snowfall record sticks". USA Today. August 3, 1999. Archived from the original on April 24, 2009. Retrieved June 30, 2009.
- ^ Mount Rainier National Park (April 14, 2006). "Frequently Asked Questions". National Park Service. Archived from the original on February 21, 2007. Retrieved June 30, 2009.
- ^ "JMA" (in Japanese). JMA. Archived from the original on June 18, 2013. Retrieved November 12, 2012.
- ^ William J. Broad (March 20, 2007). "Giant Snowflakes as Big as Frisbees? Could Be". New York Times. Archived from the original on November 4, 2011. Retrieved July 12, 2009.
- ^ "Top 10 snowiest major cities around the world". Accuweather. Retrieved March 4, 2023.
- ^ David McClung & Peter Schaerer (2006). The Avalanche Handbook. The Mountaineers Books. pp. 49–51. ISBN 978-0-89886-809-8. Retrieved July 7, 2009.
- ^ California Data Exchange Center (2007). "Depth and Density". Department of Water Resources California. Archived from the original on July 13, 2009. Retrieved July 8, 2009.
- ^ Glossary of Meteorology (2009). "Firn". American Meteorological Society. Archived from the original on August 24, 2007. Retrieved June 30, 2009.
- ^ Pidwirny, Michael; Jones, Scott (2014). "CHAPTER 10: Introduction to the Lithosphere—Glacial Processes". PhysicalGeography.net. University of British Columbia, Okanagan. Retrieved December 20, 2018.
- ^ Joy Haden (February 8, 2005). "CoCoRaHS in the Cold – Measuring in Snowy Weather" (PDF). Colorado Climate Center. Archived (PDF) from the original on July 18, 2011. Retrieved July 12, 2009.
- ^ Caroline Gammel (February 2, 2009). "Snow Britain: Snow drifts and blizzards of the past". Telegraph Media Group. Archived from the original on February 5, 2009. Retrieved July 12, 2009.
- ^ a b c McClung, David and Shaerer, Peter: The Avalanche Handbook, The Mountaineers: 2006. ISBN 978-0-89886-809-8
- ^ Howard Perlman (May 13, 2009). "The Water Cycle: Snowmelt Runoff". United States Geological Survey. Archived from the original on August 13, 2009. Retrieved July 7, 2009.
- ^ Randy Bowersox (June 20, 2002). "Hydrology of a Glacial Dominated System, Copper River, Alaska" (PDF). University of California-Davis. p. 2. Archived (PDF) from the original on June 12, 2010. Retrieved July 8, 2009.
- ^ "All About Snow—Snow Science". National Snow and Ice Data Center. University of Colorado, Boulder. 2016. Archived from the original on December 1, 2016. Retrieved November 30, 2016.
- ^ a b c Fox-Kemper, B.; Hewitt, H.T.; Xiao, C.; Aðalgeirsdóttir, G.; Drijfhout, S.S.; Edwards, T.L.; Golledge, N.R.; Hemer, M.; Kopp, R.E.; Krinner, G.; Mix, A. (2021). Masson-Delmotte, V.; Zhai, P.; Pirani, A.; Connors, S.L.; Péan, C.; Berger, S.; Caud, N.; Chen, Y.; Goldfarb, L. (eds.). "Ocean, Cryosphere and Sea Level Change" (PDF). Climate Change 2021: The Physical Science Basis. Contribution of Working Group I to the Sixth Assessment Report of the Intergovernmental Panel on Climate Change. 2021. Cambridge University Press, Cambridge, UK and New York, NY, US: 1283–1285. doi:10.1017/9781009157896.011. ISBN 9781009157896.
- ^ Hall, Dorothy K. (1985). Remote Sensing of Ice and Snow. Dordrecht: Springer Netherlands. ISBN 978-94-009-4842-6.
- ^ Hall, Dorothy K.; Box, J; Casey, K; Hook, S; Shuman, C; Steffen, K (October 15, 2008). "Comparison of satellite-derived and in-situ observations of ice and snow surface temperatures over Greenland". Remote Sensing of Environment. 112 (10): 3739–3749. Bibcode:2008RSEnv.112.3739H. doi:10.1016/j.rse.2008.05.007. hdl:2060/20080030345. S2CID 91180832.
- ^ a b Dietz, A.; Kuenzer, C.; Gessner, U.; Dech, S. (2012). "Remote Sensing of Snow – a Review of available methods". International Journal of Remote Sensing. 33 (13): 4094–4134. Bibcode:2012IJRS...33.4094D. doi:10.1080/01431161.2011.640964. S2CID 6756253.
- ^ a b David A. Kuemmel (1994). Managing roadway snow and ice control operations. Transportation Research Board. p. 10. ISBN 978-0-309-05666-3. Retrieved July 8, 2009.
- ^
Ketcham, Stephen A.; Minsk, L. David; et al. (June 1995). "Manual of Practice for an Effective Anti-icing Program: A Guide For Highway Winter Maintenance Personnel". Federal Highway Administration (FHWA). FHWA. Archived from the original on December 1, 2016. Retrieved December 1, 2016.
Highway anti-icing is the snow and ice control practice of preventing the formation or development of bonded snow and ice by timely applications of a chemical freezing-point depressant.
- ^ Jairell, R; Schmidt, R (1999), "133", Snow Management and Windbreaks (PDF), Range Beef Cow Symposium, University of Nebraska–Lincoln, p. 12, archived (PDF) from the original on May 7, 2016
- ^ ScienceDaily (February 6, 2009). "'SnowMan' Software Helps Keep Snow Drifts Off The Road". Archived from the original on April 16, 2009. Retrieved July 12, 2009.
{{cite journal}}: Cite journal requires|journal=(help) - ^ John C., Becker; Esch, David C. (1996), "Road and airfield maintenance", in Vinson, Ted S.; Rooney, James W.; Haas, Wilbur H. (eds.), Roads and Airfields in Cold Regions: A State of the Practice Report, CERF Reports, ASCE Publications, p. 252, ISBN 978-0-7844-7412-9
- ^ Transport Canada, Ottawa, ON (2016). "TP 14052. Guidelines for Aircraft Ground-Icing Operations. Chapter 8. Fluids." Archived May 27, 2014, at the Wayback Machine Retrieved May 14, 2016.
- ^ Wright, Tim (March 2004). "Electro-mechanical deicing". Air & Space Magazine. Smithsonian. Retrieved February 20, 2017.
- ^ Ells, Steve (2004). "Aircraft Deicing and Anti-icing Equipment" (PDF). Safety Advisor – Weather No. 2. Aircraft Owners and Pilots Association. Archived (PDF) from the original on December 3, 2016. Retrieved December 1, 2016.
Anti-icing equipment is turned on before entering icing conditions and is designed to prevent ice from forming. Deicing equipment is designed to remove ice after it begins to accumulate on the airframe.
- ^ Bianculli, Anthony J. (2001). The American Railroad in the Nineteenth Century – Cars. Trains and Technology. Vol. 2. Dover: University of Delaware Press. p. 170. ISBN 978-0-87413-730-9. Retrieved December 2, 2016.
- ^ FAO, Staff. "Avalanche and torrent control in the Spanish Pyrenees". National Forests Organization of Spain. Patrimonio Forestal del Estado. Archived from the original on September 24, 2015. Retrieved December 1, 2016.
- ^ Abele, G., 1990. Snow roads and runways, U.S. Army Cold Regions Research and Engineering Laboratory, Monograph 90-3, Washington, D.C.
- ^ "A New Runway for McMurdo Station is Named". National Science Foundation. April 7, 2016. Archived from the original on April 23, 2016.
- ^ Krishna Murti, C. R. (1991). The Ganga, a scientific study. Gaṅgā Pariyojanā Nideśālaya; India Environment Research Committee. Northern Book Centre. ISBN 978-8172110215. OCLC 853267663.
- ^ Albinia, Alice. (2008) Empires of the Indus: The Story of a River. First American Edition (20101) W. W. Norton & Company, New York. ISBN 978-0-393-33860-7.
- ^ "Global warming benefits to Tibet: Chinese official. Reported 18 August 2009". August 17, 2009. Archived from the original on January 23, 2010. Retrieved December 4, 2012.
- ^ Kammerer, J.C. (May 1990). "Largest Rivers in the United States". U.S. Geological Survey. Archived from the original on January 29, 2017. Retrieved July 2, 2010.
- ^ "Salazar Awards $20.1 Million to Four Western Colorado Irrigation Districts to Improve Irrigation Systems, Reduce Salinity in Colorado River". U.S. Bureau of Reclamation. October 21, 2011. Archived from the original on October 30, 2011. Retrieved March 17, 2012.
- ^ a b Joint European Commission (2003), "General actions - Snow loads", Eurocode 1, EN 1991-1-3:2003 (Actions on structures - Part 1–3)
- ^ a b Committee on Minimum Design Loads for Buildings (2013), Minimum Design Loads for Buildings and Other Structures (PDF), American Society of Civil Engineers, p. 636, ISBN 9780784413227, archived (PDF) from the original on October 11, 2016, retrieved December 2, 2016
- ^ Paul Fisette, "Preventing Ice Dams", Roofing, flashing & waterproofing. Newtown, CT: Taunton Press, 2005. 54.
- ^ Ice Dams, Minnesota Department of Commerce, archived from the original on August 24, 2007
- ^ MacKinley, I.; Flood, R.; Heidrich, A. (2000), "Roof design in regions of snow and cold", in Hjorth-Hansen, E.; Holand, I.; Loset, S.; Norem, H. (eds.), Snow Engineering 2000: Recent Advances and Developments, Rotterdam: CRC Press, p. 470, ISBN 9789058091482
- ^
Technical staff (2015). "Storms & Outages". Duke Energy. Archived from the original on December 20, 2016. Retrieved December 6, 2016.
Both snow and ice cause power outages primarily by weighing down tree limbs and power lines, causing them to break
- ^ Farzaneh, Masoud (2008), Atmospheric Icing of Power Networks, Springer Science & Business Media, p. 141, ISBN 9781402085314
- ^ Bonelli, P.; Lacavalla, M.; et al. (2011), "Wet snow hazard for power lines: a forecast and alert system applied in Italy", Natural Hazards and Earth System Sciences, 11 (9): 2419–2431, Bibcode:2011NHESS..11.2419B, doi:10.5194/nhess-11-2419-2011, S2CID 15569449
- ^ Hudson, Simon (2000). Snow Business: A Study of the International Ski Industry. Tourism (Cassell). Cengage Learning EMEA. p. 180. ISBN 9780304704712.
- ^ US patent 2676471, W. M. Pierce Jr., "Method for Making and Distributing Snow", issued December 14, 1950
- ^ On This Day: March 25 Archived April 12, 2011, at the Wayback Machine, BBC News, accessed December 20, 2006. "The first artificial snow was made two years later, in 1952, at Grossinger's resort in New York, USA. "
- ^ Jörgen Rogstam & Mattias Dahlberg (April 1, 2011), Energy usage for snowmaking (PDF), archived (PDF) from the original on February 1, 2014
- ^ Bhavikatti, S. S.; K. G. Rajashekarappa (1994). Engineering Mechanics. New Age International. p. 112. ISBN 978-81-224-0617-7. Retrieved October 21, 2007.
- ^ Chew, Allen F. (December 1981). "Fighting the Russians in Winter: Three Case Studies" (PDF). Leavenworth Papers (5). Fort Leavenworth, Kansas. ISSN 0195-3451. Archived from the original (PDF) on October 13, 2011. Retrieved December 10, 2016.
- ^ Professor Saul David (February 9, 2012). "Napoleon's failure: For the want of a winter horseshoe". BBC News magazine. Archived from the original on February 9, 2012. Retrieved February 9, 2012.
- ^ The Wordsworth Pocket Encyclopedia, p. 17, Hertfordshire 1993.
- ^ a b Clemmesen, Michael H.; Faulkner, Marcus, eds. (2013). Northern European Overture to War, 1939–1941: From Memel to Barbarossa. Brill. p. 76. ISBN 978-90-04-24908-0.
- ^ Parker, Danny S. (1991), Battle of the Bulge: Hitler's Ardennes Offensive, 1944–1945, Combined Books, ISBN 978-0-938289-04-3
- ^ Halberstam, David (2007). The Coldest Winter: America and the Korean War. New York: Hyperion. ISBN 978-1-4013-0052-4.
- ^ Tilstra, Russell C. (2014). The Battle Rifle: Development and Use Since World War II. McFarland. p. 28. ISBN 978-1-4766-1564-6.
- ^ Gusta, Lawrence V.; Tanino, Karen K.; Wisniewski, Michael E. (2009). Plant Cold Hardiness: From the Laboratory to the Field. CABI. pp. 19–27. ISBN 978-1-84593-513-9.
- ^ a b c Jones, H. G. (2001). Snow Ecology: An Interdisciplinary Examination of Snow-Covered Ecosystems. Cambridge University Press. p. 248. ISBN 978-0-521-58483-8.
- ^ Anne Minard (July 2, 2009). ""Diamond Dust" Snow Falls Nightly on Mars". National Geographic News. Archived from the original on September 17, 2009.
- ^ Agustin Chicarro, Agustin (September 22, 2008). "Mars polar cap mystery solved". Spaceref.com. European Space Agency. Archived from the original on March 7, 2023. Retrieved December 8, 2016.
...the temperature of the low-pressure system is often below the condensation point for carbon dioxide, so the gas condenses and falls from the sky as snow and builds up on the ground as frost.
- ^ Carolyn Jones Otten (2004). "'Heavy metal' snow on Venus is lead sulfide". Washington University in St Louis. Archived from the original on April 15, 2008. Retrieved August 21, 2007.
- ^ Carolina Martinez (December 12, 2006). "Massive Mountain Range Imaged on Saturn's Moon Titan". NASA. Archived from the original on March 4, 2016.
- ^ "Methane Snow on Pluto's Peaks | NASA". March 5, 2016. Archived from the original on March 5, 2016. Retrieved September 26, 2024.
External links
- United Nations Environment Programme: Global Outlook for Ice and Snow Archived June 8, 2007, at the Wayback Machine
- Institute of Low Temperature Science, Hokkaido University
- Swiss Federal Institute for Forest, Snow and Landscape Research
- National Snow and Ice Data Center of the United States
- American Society of Civil Engineers ground snow loads interactive map for the continental US

