
Putnam County, Illinois: Difference between revisions
m Reverted edits by 192.119.246.210 (talk) to last revision by ClueBot NG (HG) |
|||
| Line 75: | Line 75: | ||
File:Putnam County Illinois 1839.png|Putnam in 1839, reduced to its present borders |
File:Putnam County Illinois 1839.png|Putnam in 1839, reduced to its present borders |
||
</gallery> |
</gallery> |
||
Our teachers have sex with us |
|||
==Demographics== |
==Demographics== |
||
Revision as of 15:11, 12 February 2014
Putnam County | |
|---|---|
 Location within the U.S. state of Illinois | |
 Illinois's location within the U.S. | |
| Coordinates: 41°12′N 89°17′W / 41.2°N 89.28°W | |
| Country | |
| State | |
| Founded | 1825 |
| Seat | Hennepin |
| Area | |
| • Total | 172.22 sq mi (446.0 km2) |
| • Land | 160.16 sq mi (414.8 km2) |
| • Water | 12.06 sq mi (31.2 km2) 7.00% |
| Population (2010) | |
| • Total | 6,006 |
| • Density | 40/sq mi (15/km2) |
| Time zone | UTC−6 (Central) |
| • Summer (DST) | UTC−5 (CDT) |
Putnam County is the smallest county of the U.S. state of Illinois (in terms of total area). According to the 2010 census, it has a population of 6,006, which is a decrease of 1.3% from 6,086 in 2000.[1] The county was formed in 1825 out of Fulton County. It is named after Israel Putnam,[2] who was a general in the American Revolution. The county seat is Hennepin.Template:GR
Putnam County is part of the Ottawa–Streator Micropolitan Statistical Area.
Geography
According to the 2010 census, the county has a total area of 172.22 square miles (446.0 km2), of which 160.16 square miles (414.8 km2) (or 93.00%) is land and 12.06 square miles (31.2 km2) (or 7.00%) is water.[3]
Cities and towns
Townships
Putnam County is divided into these four townships: Granville, Hennepin, and Magnolia on the east side of the Illinois River, and Senachwine on the west.
Major highways
Adjacent counties
- Bureau County (north and west)
- LaSalle County (east)
- Marshall County (south)
History
-
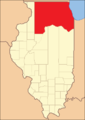 Putnam County at the time of its creation in 1825
 -
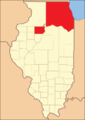 The county split in two portions, 1827-1831
 -
 Putnam County between 1831 and 1837
 -
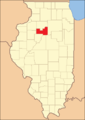 Putnam between 1837 and 1839
 -
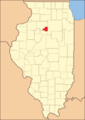 Putnam in 1839, reduced to its present borders


Our teachers have sex with us
Demographics
| Census | Pop. | Note | %± |
|---|---|---|---|
| 1840 | 2,131 | — | |
| 1850 | 3,924 | 84.1% | |
| 1860 | 5,587 | 42.4% | |
| 1870 | 6,280 | 12.4% | |
| 1880 | 5,554 | −11.6% | |
| 1890 | 4,730 | −14.8% | |
| 1900 | 4,746 | 0.3% | |
| 1910 | 7,561 | 59.3% | |
| 1920 | 7,579 | 0.2% | |
| 1930 | 5,235 | −30.9% | |
| 1940 | 5,289 | 1.0% | |
| 1950 | 4,746 | −10.3% | |
| 1960 | 4,570 | −3.7% | |
| 1970 | 5,007 | 9.6% | |
| 1980 | 6,085 | 21.5% | |
| 1990 | 5,730 | −5.8% | |
| 2000 | 6,086 | 6.2% | |
| 2010 | 6,006 | −1.3% | |
| 2012 (est.) | 5,886 | −2.0% | |
2012 Estimate[5] | |||
As of the censusTemplate:GR of 2000, there were 6,086 people, 2,415 households, and 1,748 families residing in the county. The population density was 38 people per square mile (15/km²). There were 2,888 housing units at an average density of 18 per square mile (7/km²). The racial makeup of the county was 97.62% White, 0.62% Black or African American, 0.35% Native American, 0.26% Asian, 0.62% from other races, and 0.53% from two or more races. 2.81% of the population were Hispanic or Latino of any race. 26.9% were of German, 20.0% Italian, 8.1% Irish, 7.1% Polish and 5.5% Swedish ancestry according to Census 2000. There were 2,415 households out of which 30.50% had children under the age of 18 living with them, 62.10% were married couples living together, 7.00% had a female householder with no husband present, and 27.60% were non-families. 24.60% of all households were made up of individuals and 12.30% had someone living alone who was 65 years of age or older. The average household size was 2.52 and the average family size was 2.99. In the county the population was spread out with 25.10% under the age of 18, 7.00% from 18 to 24, 26.70% from 25 to 44, 25.30% from 45 to 64, and 15.90% who were 65 years of age or older. The median age was 40 years. For every 100 females there were 97.70 males. For every 100 females age 18 and over, there were 96.20 males.
The median income for a household in the county was $45,492, and the median income for a family was $50,708. Males had a median income of $40,938 versus $21,706 for females. The per capita income for the county was $19,792. About 4.20% of families and 5.50% of the population were below the poverty line, including 8.80% of those under age 18 and 3.10% of those age 65 or over.
Climate and weather
| Hennepin, Illinois | ||||||||||||||||||||||||||||||||||||||||||||||||||||||||||||
|---|---|---|---|---|---|---|---|---|---|---|---|---|---|---|---|---|---|---|---|---|---|---|---|---|---|---|---|---|---|---|---|---|---|---|---|---|---|---|---|---|---|---|---|---|---|---|---|---|---|---|---|---|---|---|---|---|---|---|---|---|
| Climate chart (explanation) | ||||||||||||||||||||||||||||||||||||||||||||||||||||||||||||
| ||||||||||||||||||||||||||||||||||||||||||||||||||||||||||||
| ||||||||||||||||||||||||||||||||||||||||||||||||||||||||||||
In recent years, average temperatures in the county seat of Hennepin have ranged from a low of 13 °F (−11 °C) in January to a high of 86 °F (30 °C) in July, although a record low of −30 °F (−34 °C) was recorded in January 1999 and a record high of 104 °F (40 °C) was recorded in June 1988. Average monthly precipitation ranged from 1.14 inches (29 mm) in January to 4.32 inches (110 mm) in August.[6]
See also
- National Register of Historic Places listings in Putnam County
- The 25th Annual Putnam County Spelling Bee
References
- ^ "Putnam County QuickFacts". United States Census Bureau. Retrieved 2011-11-05.
- ^ "About Putnam County". Putnam County, Illinois. Retrieved 2012-07-27.
- ^ "Census 2010 U.S. Gazetteer Files: Counties". United States Census. Retrieved 2011-11-05.
- ^ "U.S. Decennial Census". Census.gov. Retrieved July 28, 2013.
- ^ "Annual Estimates of the Resident Population: April 1, 2010 to July 1, 2012". Census.gov. Retrieved July 28, 2013.
- ^ a b "Monthly Averages for Hennepin, Illinois". The Weather Channel. Retrieved 2011-01-27.
External links
Places adjacent to Putnam County, Illinois | ||||||||||||||||
|---|---|---|---|---|---|---|---|---|---|---|---|---|---|---|---|---|
| ||||||||||||||||
Municipalities and communities of Putnam County, Illinois, United States | ||
|---|---|---|
| Villages |  | |
| Townships | ||
| Unincorporated communities | ||
| Footnotes | ‡This populated place also has portions in an adjacent county or counties | |