
Statistical area (United States)
| Population tables of U.S. cities |
|---|
 |
| Cities |
| Urban areas |
| Populous cities and metropolitan areas |
| Metropolitan areas |
| Megaregions |
|
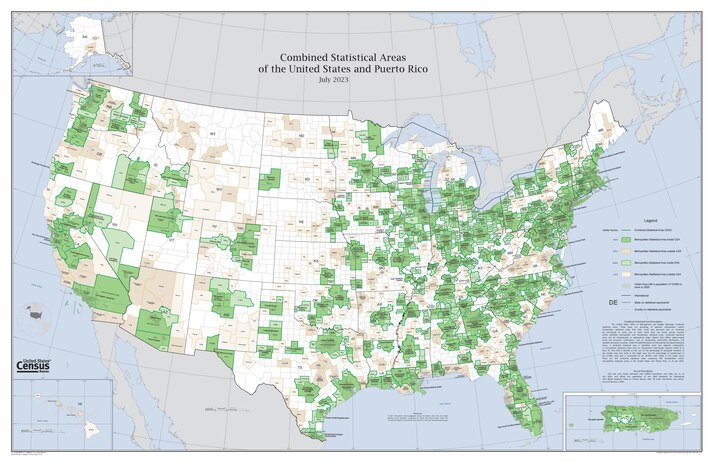
The United States federal government defines and delineates the nation's metropolitan areas for statistical purposes, using a set of standard statistical area definitions. As of 2023,[update] the U.S. Office of Management and Budget (OMB) defined and delineated 393 metropolitan statistical areas (MSAs) and 542 micropolitan statistical areas (μSAs) in the United States and Puerto Rico.[1] Many of these 935 MSAs and μSAs are, in turn, components of larger combined statistical areas (CSAs) consisting of adjacent MSAs and μSAs that are linked by commuting ties; as of 2023,[update] 582 metropolitan and micropolitan areas are components of the 184 defined CSAs. A collective term for MSAs, μSAs, and CSAs is primary statistical areas (PSAs), though that term is not used by OMB.
Metropolitan and micropolitan statistical areas are defined as consisting of one or more adjacent counties or county equivalents with at least one urban core area meeting relevant population thresholds, plus adjacent territory that has a high degree of social and economic integration with the core, as measured by commuting ties. A metropolitan statistical area has at least one core with a population of at least 50,000. In a micropolitan statistical area, the largest core has a population of at least 10,000 but less than 50,000.
Maps
[edit]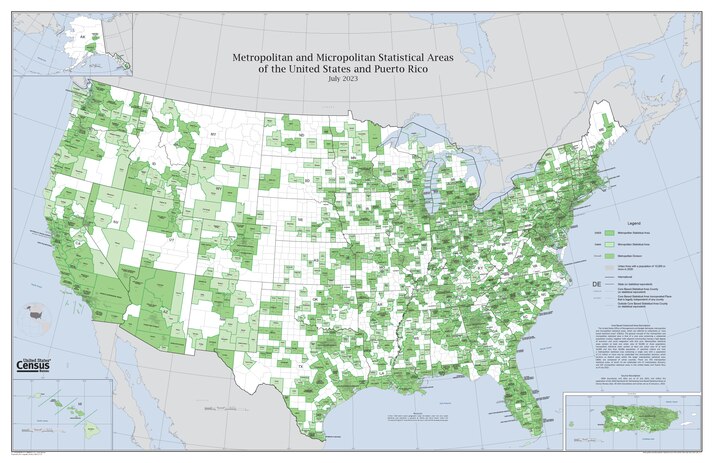
Types and distribution
[edit]The sortable table below shows the number of combined, metropolitan and micropolitan statistical areas in each of the U.S. states, the District of Columbia, and Puerto Rico as of 2023. For each jurisdiction, it lists:
- Total number of delineated areas wholly or partially in the named jurisdiction[1]
- The number of CSAs wholly or partially in the jurisdiction[1]
- The number of core-based statistical areas (i.e., MSAs and μSAs) wholly or partially in the jurisdiction[1]
- The number of MSAs wholly or partially in the jurisdiction[1]
- The number of μSAs wholly or partially in the jurisdiction[1]
| Jurisdiction | Delineated areas | CSAs | Core-based areas | MSAs | μSAs |
|---|---|---|---|---|---|
| Alabama[2] | 34 | 9 | 25 | 12 | 13 |
| Alaska | 4 | 0 | 4 | 2 | 2 |
| Arizona | 13 | 2 | 11 | 7 | 4 |
| Arkansas[2] | 25 | 4 | 21 | 7 | 14 |
| California | 42 | 7 | 35 | 25 | 10 |
| Colorado | 20 | 3 | 17 | 7 | 10 |
| Connecticut[2] | 9 | 2 | 7 | 5 | 2 |
| Delaware[2] | 4 | 1 | 3 | 2 | 1 |
| Florida[2] | 35 | 7 | 28 | 22 | 6 |
| Georgia[2] | 46 | 7 | 39 | 15 | 24 |
| Hawaiʻi | 4 | 0 | 4 | 2 | 2 |
| Idaho[2] | 22 | 5 | 17 | 7 | 10 |
| Illinois[2] | 47 | 14 | 33 | 12 | 21 |
| Indiana[2] | 50 | 10 | 40 | 15 | 25 |
| Iowa[2] | 31 | 7 | 24 | 9 | 15 |
| Kansas[2] | 25 | 3 | 22 | 7 | 15 |
| Kentucky[2] | 32 | 8 | 24 | 9 | 15 |
| Louisiana[2] | 25 | 6 | 19 | 10 | 9 |
| Maine | 5 | 1 | 4 | 3 | 1 |
| Maryland[2] | 13 | 3 | 10 | 6 | 4 |
| Massachusetts[2] | 12 | 2 | 10 | 7 | 3 |
| Michigan[2] | 43 | 8 | 35 | 16 | 19 |
| Minnesota[2] | 34 | 6 | 28 | 9 | 19 |
| Mississippi[2] | 27 | 6 | 21 | 4 | 17 |
| Missouri[2] | 31 | 6 | 25 | 7 | 18 |
| Montana | 7 | 0 | 7 | 5 | 2 |
| Nebraska[2] | 16 | 3 | 13 | 4 | 9 |
| Nevada | 10 | 2 | 8 | 3 | 5 |
| New Hampshire[2] | 8 | 2 | 6 | 2 | 4 |
| New Jersey[2] | 9 | 3 | 6 | 6 | 0 |
| New Mexico | 19 | 2 | 17 | 4 | 13 |
| New York[2] | 34 | 7 | 27 | 13 | 14 |
| North Carolina[2] | 48 | 9 | 39 | 15 | 24 |
| North Dakota[2] | 9 | 1 | 8 | 4 | 4 |
| Ohio[2] | 55 | 11 | 44 | 15 | 29 |
| Oklahoma[2] | 28 | 6 | 22 | 5 | 17 |
| Oregon[2] | 24 | 4 | 20 | 8 | 12 |
| Pennsylvania[2] | 48 | 12 | 36 | 20 | 16 |
| Rhode Island[2] | 2 | 1 | 1 | 1 | 0 |
| South Carolina[2] | 20 | 4 | 16 | 10 | 6 |
| South Dakota[2] | 14 | 2 | 12 | 3 | 9 |
| Tennessee[2] | 34 | 7 | 27 | 10 | 17 |
| Texas[2] | 80 | 13 | 67 | 26 | 41 |
| Utah[2] | 12 | 1 | 11 | 5 | 6 |
| Vermont[2] | 8 | 2 | 6 | 1 | 5 |
| Virginia[2] | 19 | 4 | 15 | 11 | 4 |
| Washington[2] | 29 | 6 | 23 | 13 | 10 |
| West Virginia[2] | 20 | 5 | 15 | 10 | 5 |
| Wisconsin[2] | 40 | 11 | 29 | 15 | 14 |
| Wyoming[2] | 10 | 0 | 10 | 2 | 8 |
| District of Columbia[3] | 2 | 1 | 1 | 1 | 0 |
| United States | 1106 | 181 | 925 | 387 | 538 |
| Puerto Rico | 13 | 3 | 10 | 6 | 4 |
| United States & Puerto Rico | 1119 | 184 | 935 | 393 | 542 |
See also
[edit]- United States of America
- Demographics of the United States
- United States Census Bureau
- United States Office of Management and Budget
- Statistical area (United States)
Notes
[edit]- ^ Because many metropolitan and micropolitan areas overlap jurisdictional boundaries, columns are not additive.
References
[edit]- ^ a b c d e f "OMB Bulletin No. 23-01: Revised Delineations of Metropolitan Statistical Areas, Micropolitan Statistical Areas, and Combined Statistical Areas, and Guidance on Uses of the Delineations of These Areas" (PDF). United States Office of Management and Budget. July 21, 2023. Retrieved May 2, 2024.
- ^ The District of Columbia shares both its statistical areas with nearby states.
External links
[edit] Definitions from Wiktionary
 Media from Commons
 News from Wikinews
 Quotations from Wikiquote
 Texts from Wikisource
 Textbooks from Wikibooks
 Resources from Wikiversity