Ohio's 5th congressional district
Appearance
(Redirected from OH-5)
| Ohio's 5th congressional district | |
|---|---|
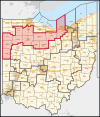
Interactive map of district boundaries since January 3, 2023 | |
| Representative | |
| Distribution |
|
| Population (2023) | 790,574[2] |
| Median household income | $70,357[2] |
| Ethnicity |
|
| Cook PVI | R+15[3] |
Ohio's 5th congressional district is in northwestern and north central Ohio and borders Indiana. The district is currently represented by Republican Bob Latta.
Recent election results from statewide races
[edit]| Year | Office | Results[4][5][6] |
|---|---|---|
| 2008 | President | McCain 50% - 48% |
| 2012 | President | Romney 54% - 46% |
| 2016 | President | Trump 60% - 35% |
| Senate | Portman 64% - 30% | |
| 2018 | Senate | Renacci 52% - 48% |
| Governor | DeWine 58% - 39% | |
| Attorney General | Yost 60% - 40% | |
| 2020 | President | Trump 63% - 36% |
| 2022 | Senate | Vance 61% - 39% |
| Governor | DeWine 71% - 29% | |
| Secretary of State | LaRose 68% - 31% | |
| Treasurer | Sprague 68% - 32% | |
| Auditor | Faber 68% - 32% | |
| Attorney General | Yost 69% - 31% | |
| 2024 | President | Trump 64% - 35% |
| Senate | Moreno 58% - 38% |
Composition
[edit]For the 118th and successive Congresses (based on redistricting following the 2020 census), the district contains all or portions of the following counties, townships, and municipalities:[7]
Crawford County (23)
- All 23 townships and municipalities
Hancock County (30)
- All 30 townships and municipalities
Henry County (22)
- All 22 townships and municipalities
Huron County (29)
- All 29 townships and municipalities
Lorain County (34)
- All 34 townships and municipalities
Mercer County (23)
- All 23 townships and municipalities
Paulding County (23)
- All 23 townships and municipalities
Putnam County (30)
- All 30 townships and municipalities
Seneca County (24)
- All 24 townships and municipalities
Van Wert County (22)
- All 22 townships and municipalities
Wood County (37)
- Bairdstown, Bloomdale, Bloom Township, Bowling Green, Bradner, Center Township, Custar, Cygnet, Freedom Township, Grand Rapids, Grand Rapids Township, Haskins, Henry Township, Hoytville, Jackson Township, Jerry City, Liberty Township, Luckey, Middleton Township (part; also 9th), Milton Center, Milton Township, Montgomery Township, North Baltimore, Pemberville, Perry Township, Plain Township, Portage, Portage Township, Risingsun, Tontogany, Troy Township, Washington Township, Wayne, Webster Township, West Millgrove, Weston, Weston Township
Wyandot County (17)
- Antrim Township, Carey, Crane Township, Crawford Township, Eden Township, Harpster, Mifflin Township, Nevada, Pitt Township, Richland Township, Ridge Township, Salem Township, Sycamore, Sycamore Township, Tymochtee Township, Upper Sandusky, Wharton
List of members representing the district
[edit]Election results
[edit]The following chart shows historic election results. Bold type indicates victor. Italic type indicates incumbent.
| Year | Democratic | Republican | Other |
|---|---|---|---|
| 1812 | District created following the 1810 census. | ||
| ... | |||
| 1920 | Newt Bronson: 25,395 | Charles J. Thompson: 40,381 | |
| 1922 | Frank C. Kniffin: 28,067 | Charles J. Thompson: 31,700 | |
| 1924 | Frank C. Kniffin: 29,245 | Charles J. Thompson: 31,045 | |
| 1926 | Frank C. Kniffin: 23,022 | Charles J. Thompson: 23,638 | |
| 1928 | Frank C. Kniffin: 31,385 | Charles J. Thompson: 36,096 | |
| 1930 | Frank C. Kniffin: 29,117 | Charles J. Thompson: 27,497 | |
| 1932 | Frank C. Kniffin: 44,433 | William L. Manahan: 29,605 | |
| 1934 | Frank C. Kniffin: 34,249 | Davis B. Johnson: 27,423 | |
| 1936 | Frank C. Kniffin: 41,693 | Stephan S. Beard: 33,212 | Fred L. Hay: 3,663 |
| 1938 | Frank C. Kniffin: 28,109 | Cliff Clevenger: 37,027 | |
| 1940 | C. H. Armbruster: 31,063 | Cliff Clevenger: 48,040 | |
| 1942 | Ferdinand E. Warren: 17,514 | Cliff Clevenger: 30,667 | |
| 1944 | T. Walter Williams: 22,740 | Cliff Clevenger: 48,490 | |
| 1946 | Willard Thomas: 20,163 | Cliff Clevenger: 30,623 | |
| 1948 | Dan Batt: 32,076 | Cliff Clevenger: 34,950 | |
| 1950 | Dan Batt: 26,689 | Cliff Clevenger: 36,096 | |
| 1952 | Dan Batt: 42,104 | Cliff Clevenger: 72,168 | |
| 1954 | Martin W. Feigert: 33,483 | Cliff Clevenger: 49,265 | |
| 1956 | George E. Rafferty: 42,181 | Cliff Clevenger: 69,774 | |
| 1958 | George E. Rafferty: 44,971 | Delbert L. Latta: 52,612 | |
| 1960 | Tom T. McRitchie: 41,375 | Delbert L. Latta: 85,175 | |
| 1962 | William T. Hunt: 29,114 | Delbert L. Latta: 69,272 | |
| 1964 | Milford Landis: 41,621 | Delbert L. Latta: 80,394 | |
| 1966 | John H. Shock: 26,503 | Delbert L. Latta: 80,906 | |
| 1968 | Louis Richard Batzler: 45,884 | Delbert L. Latta: 113,381 | |
| 1970 | Carl G. Sherer: 37,545 | Delbert L. Latta: 92,577 | |
| 1972 | Bruce Edwards: 49,465 | Delbert L. Latta: 132,032 | |
| 1974 | Bruce Edwards: 53,391 | Delbert L. Latta: 89,161 | |
| 1976 | Bruce Edwards: 60,304 | Delbert L. Latta: 124,910 | |
| 1978 | James R. Sherck: 51,071 | Delbert L. Latta: 85,547 | |
| 1980 | James R. Sherck: 57,704 | Delbert L. Latta: 137,003 | |
| 1982 | James R. Sherck: 70,120 | Delbert L. Latta: 86,450 | |
| 1984 | James R. Sherck: 78,809 | Delbert L. Latta: 132,582 | |
| 1986 | Tom Murray: 54,864 | Delbert L. Latta: 102,016 | |
| 1988 | Tom Murray: 80,472 | Paul E. Gillmor: 128,838 | |
| 1990 | P. Scott Mange: 41,693 | Paul E. Gillmor: 113,615 | John E. Jackson: 10,612 |
| 1992 | Paul E. Gillmor: 187,860 | ||
| 1994 | Jarrod Tudor: 49,335 | Paul E. Gillmor: 135,879 | |
| 1996 | Annie Saunders: 81,170 | Paul E. Gillmor: 145,892 | David J. Schaffer (N): 11,461 |
| 1998 | Susan Davenport Darrow: 61,926 | Paul E. Gillmor: 123,979 | |
| 2000 | Dannie Edmon: 62,138 | Paul E. Gillmor: 169,857 | John F. Green (L): 5,464 David J. Schaffer (N): 5,881 |
| 2002 | Roger Anderson: 51,872 | Paul E. Gillmor: 126,286 | John F. Green: 10,096 |
| 2004 | Robin Weirauch: 95,481 | Paul E. Gillmor: 194,559 | |
| 2006 | Robin Weirauch: 95,955 | Paul E. Gillmor : 126,898 | |
| 2007* | Robin Weirauch: 32,246 | Robert E. Latta: 41,740 | |
| 2008 | George Mays: 105,840 | Robert E. Latta: 188,905 | [8] |
| 2012[9] | Angela Zimmann: 137,806 | Robert E. Latta: 201,514 | Eric Eberly (L) : 12,558 |
| 2014[10] | Robert Fry: 57,328 | Robert E. Latta: 132,448 | Eric Eberly (L) : 9,142 |
| 2016 | James L. Neu Jr.: 100,392 | Robert E. Latta: 244,599 | |
| 2018 | J. Michael Galbraith: 99,655 | Robert E. Latta: 176,569 | Don Kissick (L): 7,393 |
| 2020 | Nick Rubando: 120,962 | Robert E. Latta: 257,019 | |
| 2022 | Craig Swartz: 92,634 | Robert E. Latta: 187,303 | |
2010
[edit]| Party | Candidate | Votes | % | |
|---|---|---|---|---|
| Republican | Bob Latta* | 140,703 | 67.82 | |
| Democratic | Caleb Finkenbiner | 54,919 | 26.47 | |
| Libertarian | Brian Smith | 11,831 | 5.70 | |
| Total votes | 207,453 | 100.00 | ||
| Turnout | ||||
| Republican hold | ||||
2012
[edit]| Party | Candidate | Votes | % | |
|---|---|---|---|---|
| Republican | Bob Latta (incumbent) | 201,514 | 57.3 | |
| Democratic | Angela Zimmann | 137,806 | 39.2 | |
| Libertarian | Eric Eberly | 12,558 | 3.5 | |
| Total votes | 351,878 | 100.0 | ||
| Republican hold | ||||
2014
[edit]| Party | Candidate | Votes | % | |
|---|---|---|---|---|
| Republican | Bob Latta (incumbent) | 134,449 | 66.5 | |
| Democratic | Robert Fry | 58,507 | 28.9 | |
| Libertarian | Eric Eberly | 9,344 | 4.6 | |
| Total votes | 202,300 | 100.0 | ||
| Republican hold | ||||
2016
[edit]| Party | Candidate | Votes | % | |
|---|---|---|---|---|
| Republican | Bob Latta (incumbent) | 244,599 | 70.9 | |
| Democratic | James L. Neu Jr. | 100,392 | 29.1 | |
| Total votes | 344,991 | 100.0 | ||
| Republican hold | ||||
2018
[edit]| Party | Candidate | Votes | % | ||
|---|---|---|---|---|---|
| Republican | Bob Latta (incumbent) | 176,569 | 62.3 | ||
| Democratic | J. Michael Galbraith | 99,655 | 35.1 | ||
| Libertarian | Don Kissick | 7,393 | 2.6 | ||
| Total votes | 283,617 | 100.0 | |||
| Republican hold | |||||
2020
[edit]| Party | Candidate | Votes | % | |
|---|---|---|---|---|
| Republican | Bob Latta (incumbent) | 257,019 | 68.0 | |
| Democratic | Nick Rubando | 120,962 | 32.0 | |
| Total votes | 377,981 | 100.0 | ||
| Republican hold | ||||
2022
[edit]| Party | Candidate | Votes | % | ||
|---|---|---|---|---|---|
| Republican | Bob Latta (incumbent) | 187,303 | 66.9 | ||
| Democratic | Craig Swartz | 92,634 | 33.1 | ||
| Total votes | 279,937 | 100.0 | |||
| Republican hold | |||||
Historical district boundaries
[edit]
2003–2013
2013–2023
See also
[edit]- Ohio's congressional districts
- List of United States congressional districts
- Ohio's 5th congressional district special election, 2007
References
[edit]- ^ Geography. "Congressional Districts Relationship Files (state-based) Bureau". www.census.gov. Retrieved April 9, 2018.
- ^ a b "My Congressional District". US Census. Retrieved September 22, 2024.
- ^ "2022 Cook PVI: District Map and List". Cook Political Report. July 12, 2022. Retrieved January 10, 2023.
- ^ https://davesredistricting.org/maps#viewmap::64d56870-70ea-4f4d-b667-9a4fd60ac511
- ^ https://opoliticsguru.github.io/2024-Presidential-Election-Results-Ohio/#6/42.253/-77.783
- ^ "2024 U.S. Senate Election in Ohio: Official Results".
- ^ https://www2.census.gov/geo/maps/cong_dist/cd118/cd_based/ST39/CD118_OH05.pdf
- ^ Federal Elections 2008. Federal Elections Commission, Washington DC, July 2009
- ^ "2012 Election Results". Ohio Secretary of State. Archived from the original on July 30, 2013. Retrieved July 31, 2013.
- ^ "2014 Election Results". Ohio Secretary of State.
- Martis, Kenneth C. (1989). The Historical Atlas of Political Parties in the United States Congress. New York: Macmillan Publishing Company.
- Martis, Kenneth C. (1982). The Historical Atlas of United States Congressional Districts. New York: Macmillan Publishing Company.
- Congressional Biographical Directory of the United States 1774–present

