North Hertfordshire District Council elections
Appearance
(Redirected from North Hertfordshire local elections)
One third of North Hertfordshire District Council in England is elected each year, followed by one year without election. A boundary review is underway to allow the council to instead be elected all at once every four years from 2024 onwards.[1]
Elections
[edit]The elections have been as follows:[2][3]
| Year | Seats | Conservative | Labour | Liberal Democrats[a] | Ratepayers | Independent | Notes |
|---|---|---|---|---|---|---|---|
| 1973 | 48 | 23 | 17 | 0 | 1 | 7 | |
| 1976 | 48 | 30 | 11 | 0 | 2 | 5 | |
| 1979 | 50 | 34 | 12 | 0 | 2 | 2 | New ward boundaries.[4] |
| 1980 | 50 | 32 | 14 | 0 | 2 | 2 | |
| 1982 | 50 | 32 | 14 | 0 | 2 | 2 | |
| 1983 | 50 | 30 | 15 | 1 | 2 | 2 | |
| 1984 | 50 | 31 | 12 | 2 | 3 | 2 | |
| 1986 | 50 | 26 | 14 | 7 | 3 | 0 | |
| 1987 | 50 | 26 | 13 | 8 | 3 | 0 | |
| 1988 | 50 | 27 | 13 | 7 | 3 | 0 | |
| 1990 | 50 | 29 | 15 | 3 | 3 | 0 | District boundary changes took place but the number of seats remained the same.[5][6] |
| 1991 | 50 | 26 | 18 | 2 | 3 | 1 | |
| 1992 | 50 | 26 | 17 | 3 | 3 | 1 | |
| 1994 | 50 | 25 | 18 | 5 | 1 | 1 | |
| 1995 | 50 | 22 | 21 | 6 | 0 | 1 | |
| 1996 | 50 | 16 | 26 | 7 | 0 | 1 | |
| 1998 | 50 | 17 | 26 | 6 | 0 | 1 | |
| 1999 | 49 | 28 | 18 | 3 | 0 | 0 | New ward boundaries.[7] |
| 2000 | 49 | 29 | 18 | 2 | 0 | 0 | |
| 2002 | 49 | 28 | 17 | 4 | 0 | 0 | |
| 2003 | 49 | 27 | 16 | 6 | 0 | 0 | |
| 2004 | 49 | 28 | 14 | 7 | 0 | 0 | |
| 2006 | 49 | 33 | 9 | 7 | 0 | 0 | |
| 2007 | 49 | 30 | 10 | 9 | 0 | 0 | New ward boundaries.[8] |
| 2008 | 49 | 32 | 8 | 9 | 0 | 0 | |
| 2010 | 49 | 33 | 7 | 9 | 0 | 0 | |
| 2011 | 49 | 34 | 7 | 8 | 0 | 0 | |
| 2012 | 49 | 33 | 10 | 6 | 0 | 0 | |
| 2014 | 49 | 34 | 12 | 3 | 0 | 0 | |
| 2015 | 49 | 36 | 11 | 2 | 0 | 0 | |
| 2016 | 49 | 34 | 12 | 3 | 0 | 0 | |
| 2018 | 49 | 29 | 14 | 6 | 0 | 0 | |
| 2019 | 49 | 22 | 16 | 11 | 0 | 0 | |
| 2021 | 49 | 23 | 15 | 11 | 0 | 0 | |
| 2022 | 49 | 19 | 17 | 13 | 0 | 0 | |
| 2023 | 49 | 15 | 19 | 15 | 0 | 0 | |
| 2024 | 51 | 7 | 25 | 19 | 0 | 0 | New ward boundaries.[9] |
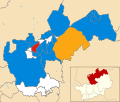
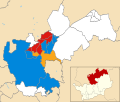
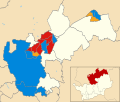
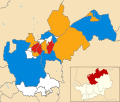
Borough result maps
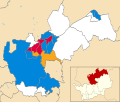
[edit]-
2015 results map
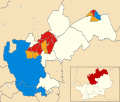
-
2016 results map
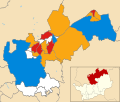
-
2018 results map
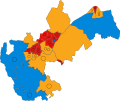
-
2019 results map
-
2021 results map
-
2022 results map
-
2023 results map
-
2024 results map
By-elections
[edit]2002-2006
[edit]| Party | Candidate | Votes | % | ±% | |
|---|---|---|---|---|---|
| Liberal Democrats | Marilyn Kirkland[11] | 331 | 48.3 | −4.7 | |
| Conservative | 324 | 47.2 | +0.2 | ||
| Labour | 31 | 4.5 | +4.5 | ||
| Majority | 7 | 1.0 | |||
| Turnout | 686 | ||||
| Liberal Democrats hold | Swing | ||||
2010-2014
[edit]| Party | Candidate | Votes | % | ±% | |
|---|---|---|---|---|---|
| Conservative | Faye Barnard | 774 | 56.8 | −7.4 | |
| UKIP | Peter Robbins | 217 | 15.9 | +15.9 | |
| Labour | Jackie McDonald | 189 | 13.9 | −3.1 | |
| Liberal Democrats | Peter Johnson | 110 | 8.1 | +0.4 | |
| Green | George Howe | 72 | 5.3 | −5.8 | |
| Majority | 557 | 40.9 | |||
| Turnout | 1,362 | ||||
| Conservative hold | Swing | ||||
| Party | Candidate | Votes | % | ±% | |
|---|---|---|---|---|---|
| Conservative | Julian Cunningham | 761 | 51.3 | −2.7 | |
| Labour | Martin Stears-Handscomb | 399 | 26.9 | +7.1 | |
| UKIP | John Barry | 184 | 12.4 | +12.4 | |
| Liberal Democrats | Margaret Higbid | 88 | 5.9 | −7.6 | |
| Green | Mario May | 51 | 3.4 | −9.3 | |
| Majority | 362 | 24.4 | |||
| Turnout | 1,483 | ||||
| Conservative hold | Swing | ||||
| Party | Candidate | Votes | % | ±% | |
|---|---|---|---|---|---|
| Labour | Frank Radcliffe | 361 | 48.0 | −12.8 | |
| Conservative | Mara MacSeoinin | 180 | 23.9 | −0.7 | |
| UKIP | Peter Croft | 148 | 19.7 | +19.7 | |
| Green | Jacqueline Greatorex | 32 | 4.3 | −5.5 | |
| Liberal Democrats | Clare Body | 31 | 4.1 | −0.7 | |
| Majority | 181 | 24.1 | |||
| Turnout | 752 | ||||
| Labour hold | Swing | ||||
2014-2018
[edit]| Party | Candidate | Votes | % | ±% | |
|---|---|---|---|---|---|
| Labour | Martin Stears-Handscomb | 258 | 31.9 | −17.4 | |
| Independent | Jackie McDonald | 200 | 24.8 | +24.8 | |
| Conservative | Serena Farrow | 158 | 19.6 | −12.4 | |
| Liberal Democrats | Louise Peace | 150 | 18.6 | +9.9 | |
| Green | George Howe | 42 | 5.2 | −4.8 | |
| Majority | 58 | 7.2 | |||
| Turnout | 808 | ||||
| Labour hold | Swing | ||||
| Party | Candidate | Votes | % | ±% | |
|---|---|---|---|---|---|
| Conservative | Raymond Shakespeare-Smith | 717 | 41.7 | −2.6 | |
| Liberal Democrats | John Hefford | 394 | 22.9 | +12.3 | |
| Independent | Jacqueline McDonald | 277 | 16.1 | +6.1 | |
| Labour | Dave Winstanley | 219 | 12.7 | −5.5 | |
| Green | Des Stephens | 114 | 6.6 | −2.6 | |
| Majority | 323 | 7.2 | |||
| Turnout | 1,721 | ||||
| Conservative hold | Swing | ||||
| Party | Candidate | Votes | % | ±% | |
|---|---|---|---|---|---|
| Conservative | Sarah Dingley | 844 | 50.4 | −0.6 | |
| Liberal Democrats | Carol Stanier | 470 | 28.1 | +14.7 | |
| Labour | Vaughan West | 196 | 11.7 | −4.6 | |
| Green | Katherine Shann | 97 | 5.8 | −1.3 | |
| UKIP | Christopher Arquati | 68 | 4.1 | −8.0 | |
| Majority | 374 | 22.3 | |||
| Turnout | 1,675 | ||||
| Conservative hold | Swing | ||||
2018-2022
[edit]| Party | Candidate | Votes | % | ±% | |
|---|---|---|---|---|---|
| Liberal Democrats | Raj Bhakar | 1,238 | 67.0 | +18.6 | |
| Conservative | Samuel Forsyth | 450 | 24.3 | −3.8 | |
| Green | Deolinda Eltringham | 134 | 7.2 | −1.1 | |
| CPA | Leigh Smith | 27 | 1.5 | +0.4 | |
| Majority | 788 | 42.6 | |||
| Turnout | 1,849 | ||||
| Liberal Democrats hold | Swing | ||||
2022-2026
[edit]| Party | Candidate | Votes | % | ±% | |
|---|---|---|---|---|---|
| Labour | Sarah Lucas | 302 | 25.9 | ||
| Liberal Democrats | Gill Lewis | 298 | 25.6 | ||
| Conservative | Callum Bartram-Bell | 280 | 24.1 | ||
| Reform UK | John Froggett | 196 | 16.8 | ||
| Green | Peter Wilkin | 88 | 7.6 | ||
| Majority | 4 | 0.3 | |||
| Turnout | 1,164 | ||||
| Labour hold | Swing | ||||
References
[edit]- ^ "North Hertfordshire". Local Government Boundary Commission for England. Retrieved 9 April 2023.
- ^ Rallings, Colin; Thrasher, Michael. "North Hertfordshire District Council Election Results 1973–2012" (PDF). The Elections Centre. Plymouth University. Retrieved 4 March 2023.
- ^ Teale, Andrew. "North Hertfordshire". Local Elections Archive Project. Retrieved 9 April 2023.
- ^ The District of North Hertfordshire (Electoral Arrangements) Order 1977 (S.I. 1977/1442)
- ^ "The Bedfordshire and Hertfordshire (County Boundaries) Order 1989", legislation.gov.uk, The National Archives, SI 1989/284, retrieved 5 November 2015
- ^ "The Cambridgeshire, Essex, Hertfordshire and Lincolnshire (County Boundaries) Order 1939", legislation.gov.uk, The National Archives, SI 1989/133, retrieved 5 November 2015
- ^ "The District of North Hertfordshire (Electoral Changes) Order 1998", legislation.gov.uk, The National Archives, SI 1998/2555, retrieved 4 October 2015
- ^ "The District of North Hertfordshire (Electoral Changes) Order 2006", legislation.gov.uk, The National Archives, SI 2006/3112, retrieved 3 November 2015
- ^ "The North Hertfordshire (Electoral Changes) Order 2023", legislation.gov.uk, The National Archives, SI 2023/1024, retrieved 12 May 2024
- ^ "Local Elections Archive Project — Baldock East Ward". www.andrewteale.me.uk. Retrieved 11 May 2024.
- ^ "Meeting of the Council held in the Council Chamber, Council Offices, Gernon Road, Letchworth Garden City on Thursday, 8 December 2005 at 7.30 p.m" (PDF). North Hertfordshire District Council. Retrieved 28 May 2024.
- ^ "Local Elections Archive Project — Hitchwood, Offa and Hoo Ward". www.andrewteale.me.uk. Retrieved 11 May 2024.
- ^ "Local Elections Archive Project — Letchworth South West Ward". www.andrewteale.me.uk. Retrieved 11 May 2024.
- ^ "Local Elections Archive Project — Hitchin Oughton Ward". www.andrewteale.me.uk. Retrieved 11 May 2024.
- ^ "Local Elections Archive Project — Hitchin Oughton Ward". www.andrewteale.me.uk. Retrieved 11 May 2024.
- ^ "Local Elections Archive Project — Hitchin Priory Ward". www.andrewteale.me.uk. Retrieved 11 May 2024.
- ^ "Local Elections Archive Project — Royston Heath Ward". www.andrewteale.me.uk. Retrieved 11 May 2024.
- ^ "Local Elections Archive Project — Hitchin Highbury Ward". www.andrewteale.me.uk. Retrieved 11 May 2024.
- ^ "Local Elections Archive Project — Royston Palace Ward". www.andrewteale.me.uk. Retrieved 11 November 2024.

