Ipswich Borough Council elections
Appearance
(Redirected from Ipswich local elections)
[1] Ipswich Borough Council elections are held three years out of every four to elect members of Ipswich Borough Council in Suffolk, England. Since the last boundary changes in 2002 the council has comprised 48 councillors representing 16 wards with each ward electing three councillors.[2]
Council elections
[edit]- 1973 Ipswich Borough Council election
- 1976 Ipswich Borough Council election
- 1979 Ipswich Borough Council election (New ward boundaries)[3]
- 1980 Ipswich Borough Council election
- 1982 Ipswich Borough Council election
- 1983 Ipswich Borough Council election
- 1984 Ipswich Borough Council election
- 1986 Ipswich Borough Council election (Borough boundary changes took place but the number of seats remained the same)[4]
- 1987 Ipswich Borough Council election
- 1988 Ipswich Borough Council election
- 1990 Ipswich Borough Council election
- 1991 Ipswich Borough Council election
- 1992 Ipswich Borough Council election
- 1994 Ipswich Borough Council election
- 1995 Ipswich Borough Council election
- 1996 Ipswich Borough Council election
- 1998 Ipswich Borough Council election
- 1999 Ipswich Borough Council election
- 2000 Ipswich Borough Council election
- 2002 Ipswich Borough Council election (New ward boundaries)[2]
- 2003 Ipswich Borough Council election
- 2004 Ipswich Borough Council election
- 2006 Ipswich Borough Council election
- 2007 Ipswich Borough Council election
- 2008 Ipswich Borough Council election
- 2010 Ipswich Borough Council election
- 2011 Ipswich Borough Council election
- 2012 Ipswich Borough Council election
- 2014 Ipswich Borough Council election
- 2015 Ipswich Borough Council election
- 2016 Ipswich Borough Council election
- 2018 Ipswich Borough Council election
- 2019 Ipswich Borough Council election
- 2021 Ipswich Borough Council election
- 2022 Ipswich Borough Council election
- 2023 Ipswich Borough Council election
- 2024 Ipswich Borough Council election
Result maps
[edit]-
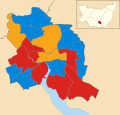
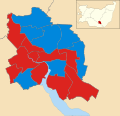
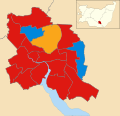
2002 results map
-
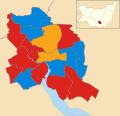
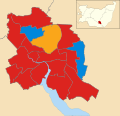
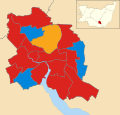
2003 results map
-
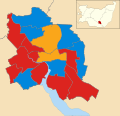
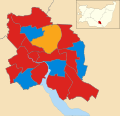
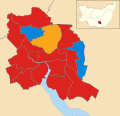
2004 results map
-
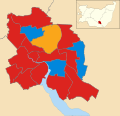
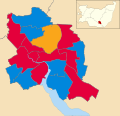
2006 results map
-
2007 results map
-
2008 results map
-
2010 results map
-
2011 results map
-
2012 results map
-
2014 results map
-
2015 results map
-
2016 results map
-
2018 results map
-
2019 results map
-
2021 results map
-
2022 results map
-
2023 results map
-
2024 results map
Election apportionment diagrams
[edit]-
2002 Election apportionment diagram
-
2003 Election apportionment diagram
-
2016 Election apportionment diagram
-
2019 Election apportionment diagram
-
2021 Election apportionment diagram
By-election results
[edit]1998-2002
[edit]| Party | Candidate | Votes | % | ±% | |
|---|---|---|---|---|---|
| Conservative | 883 | 43.2 | +2.9 | ||
| Liberal Democrats | 764 | 37.4 | +1.6 | ||
| Labour | 397 | 19.4 | −4.6 | ||
| Majority | 119 | 5.8 | |||
| Turnout | 2,044 | 33.2 | |||
| Conservative hold | Swing | ||||
| Party | Candidate | Votes | % | ±% | |
|---|---|---|---|---|---|
| Labour | 629 | 53.4 | +0.1 | ||
| Conservative | 411 | 34.9 | +3.6 | ||
| Liberal Democrats | 137 | 11.6 | −3.8 | ||
| Majority | 218 | 18.5 | |||
| Turnout | 1,177 | 19.1 | |||
| Labour hold | Swing | ||||
| Party | Candidate | Votes | % | ±% | |
|---|---|---|---|---|---|
| Labour | 1,800 | 59.5 | +10.8 | ||
| Conservative | 839 | 27.7 | −13.0 | ||
| Liberal Democrats | 386 | 12.8 | +2.2 | ||
| Majority | 961 | 31.8 | |||
| Turnout | 3,025 | ||||
| Labour hold | Swing | ||||
2006-2010
[edit]| Party | Candidate | Votes | % | ±% | |
|---|---|---|---|---|---|
| Conservative | Robin Vickery | 1,028 | 60.6 | +11.8 | |
| Labour | John Harris | 385 | 22.7 | +3.5 | |
| Liberal Democrats | Nigel Cheeseman | 284 | 16.7 | −6.0 | |
| Majority | 643 | 37.9 | |||
| Turnout | 1,697 | 28.7 | |||
| Conservative hold | Swing | ||||
| Party | Candidate | Votes | % | ±% | |
|---|---|---|---|---|---|
| Conservative | Mary Young | 843 | 64.3 | +3.3 | |
| Labour | John Harris | 282 | 21.5 | +2.9 | |
| Liberal Democrats | Nigel Cheeseman | 186 | 14.2 | −0.4 | |
| Majority | 561 | 42.8 | |||
| Turnout | 1,311 | 22.3 | |||
| Conservative hold | Swing | ||||
2010-2014
[edit]| Party | Candidate | Votes | % | ±% | |
|---|---|---|---|---|---|
| Liberal Democrats | Cathy French | 942 | 41.8 | +6.7 | |
| Conservative | Stephen Ion | 871 | 38.7 | +1.7 | |
| Labour | Glen Chisholm | 439 | 19.5 | −1.8 | |
| Majority | 71 | 3.1 | |||
| Turnout | 2,252 | 35.8 | |||
| Liberal Democrats gain from Conservative | Swing | 2.5 | |||
| Party | Candidate | Votes | % | ±% | |
|---|---|---|---|---|---|
| Labour | John Cook | 772 | 47.0 | −7.0 | |
| UKIP | Alan Cotterell | 279 | 17.0 | +17.0 | |
| Conservative | Edward Phillips | 274 | 16.7 | +0.0 | |
| Green | Tom Wilmot | 193 | 11.7 | +1.1 | |
| Liberal Democrats | Ken Toye | 126 | 7.7 | −11.0 | |
| Majority | 493 | 30.0 | |||
| Turnout | 1,644 | ||||
| Labour gain from Liberal Democrats | Swing | ||||
| Party | Candidate | Votes | % | ±% | |
|---|---|---|---|---|---|
| Labour | Colin Wright | 630 | 41.7 | −19.9 | |
| UKIP | James Crossley | 537 | 35.5 | +35.5 | |
| Conservative | Paul West | 238 | 15.7 | −12.1 | |
| Green | Geoff Reynish | 55 | 3.6 | +3.6 | |
| Liberal Democrats | Moira Kleissner | 52 | 3.4 | −7.2 | |
| Majority | 93 | 6.2 | |||
| Turnout | 1,512 | ||||
| Labour hold | Swing | ||||
2014-2018
[edit]| Party | Candidate | Votes | % | ±% | |
|---|---|---|---|---|---|
| Conservative | Bob Hall | 899 | 49.6 | +4.0 | |
| Labour | Collette Allen | 659 | 36.3 | −10.4 | |
| UKIP | Alan Cotterell | 143 | 7.9 | +7.9 | |
| Liberal Democrats | Maureen Haaker | 59 | 3.3 | −4.4 | |
| Green | Adria Pittock | 53 | 2.9 | +2.9 | |
| Majority | 240 | 13.2 | |||
| Turnout | 1,813 | ||||
| Conservative hold | Swing | ||||
2018-2022
[edit]| Party | Candidate | Votes | % | ±% | |
|---|---|---|---|---|---|
| Labour | Adam Rae | 734 | 50.2 | −3.5 | |
| Liberal Democrats | Henry Williams | 287 | 19.6 | +10.7 | |
| Conservative | Lee Reynolds | 278 | 19.0 | −0.7 | |
| Green | Tom Wilmot | 164 | 11.2 | −6.5 | |
| Majority | 447 | 30.6 | |||
| Turnout | 1,463 | ||||
| Labour hold | Swing | ||||
2022-2026
[edit]| Party | Candidate | Votes | % | ±% | |
|---|---|---|---|---|---|
| Labour | Roxanne Downes | 653 | 59.9 | +6.3 | |
| Conservative | Gregor McNie | 314 | 28.8 | −4.1 | |
| Liberal Democrats | Trevor Powell | 123 | 11.3 | +5.9 | |
| Majority | 339 | 31.1 | |||
| Turnout | 1,090 | ||||
| Labour hold | Swing | ||||
References
[edit]- ^ "Log in - Wikipedia". wiki.riteme.site. Retrieved 13 July 2024.
- ^ a b "The Borough of Ipswich (Electoral Changes) Order 2001", legislation.gov.uk, The National Archives, SI 2001/3890, retrieved 6 January 2024
- ^ The Borough of Ipswich (Electoral Arrangements) Order 1978
- ^ The Ipswich and Suffolk Coastal (District Boundaries) Order 1985
- ^ "Castle Hill by-election result". Ipswich borough council. Retrieved 30 July 2008.
- ^ "Local Elections Archive Project — Alexandra Ward". www.andrewteale.me.uk. Retrieved 14 February 2024.
- ^ "Local Elections Archive Project — Whitehouse Ward". www.andrewteale.me.uk. Retrieved 14 February 2024.
- ^ "Local Elections Archive Project — Stoke Park Ward". www.andrewteale.me.uk. Retrieved 14 February 2024.
- ^ "Local Elections Archive Project — Alexandra Ward". www.andrewteale.me.uk. Retrieved 14 February 2024.
- ^ "Local Elections Archive Project — Priory Heath Ward". www.andrewteale.me.uk. Retrieved 14 February 2024.


