Illinois's 4th congressional district
| Illinois's 4th congressional district | |
|---|---|
Interactive map of district boundaries since January 3, 2023 | |
| Representative | |
| Area | 97.0 sq mi (251 km2) |
| Distribution |
|
| Population (2023) | 704,764 |
| Median household income | $75,442[1] |
| Ethnicity |
|
| Cook PVI | D+22[2] |
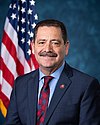
The 4th congressional district of Illinois includes part of Cook County, and has been represented by Democrat Jesús "Chuy" García since January 2019.
In November 2017, incumbent Luis Gutiérrez announced that he would retire from Congress at the end of his current term, and not seek re-election in 2018.[3][4] Jesús "Chuy" García was elected on November 6, 2018.
The previous version of the district from 2013–2023 was featured by The Economist as one of the most strangely drawn and gerrymandered congressional districts in the country,[5] inspired the "Ugly Gerry" gerrymandering typeface,[6] and has been nicknamed "earmuffs" due to its shape.[7] That version of the district was created after federal courts ordered the creation of a majority-Hispanic district in the Chicago area. The Illinois General Assembly responded by packing two majority Hispanic parts of Chicago into a single district.
The 2013–2023 version of the district formerly covered two strips running east–west across the city of Chicago, on the west side continuing into smaller portions of some suburban areas in Cook County, surrounding Illinois's 7th congressional district. The northern portion is largely Puerto Rican, while the southern portion is heavily Mexican-American. These two sections were only connected by a piece of Interstate 294 to the west; the highway is in the district while the surrounding areas are not. This version of the district was the smallest congressional district in area outside New York City and California.[8]
Geographic boundaries
[edit]The Illinois 4th congressional district was originally formed in 1842. It included 17 counties, which were Cook, Lake, McHenry, Boone, De Kalb, Kane, Du Page, Will, Kendall, Grundy, LaSalle, Bureau, Livingston, Iroquois, McLean, Vermilion and Champaign Counties. Beyond this Ford and Kankakee Counties were part of Vermillion and Iroquois Counties respectively at this point and thus in the district's boundaries.[9]
In the redistricting following the 1990 United States census, Chicago Mayor Richard M. Daley and Governor Jim Edgar both wanted a Latino district, as Latinos were the fastest growing demographic group in the state at the time. In June 1991, Congressman Dennis Hastert, a suburban Republican, filed a federal lawsuit claiming that the existing congressional map was unconstitutional;[10] the present congressional district boundaries emerged as a result of that lawsuit. A three-judge panel of the federal district court adopted the map proposed by Hastert and other Republican members of the Illinois Congressional delegation.[11] Subsequent lawsuits challenging the redistricting as racially biased[12] did not succeed in redrawing the district boundaries. The district, as it was in 2009, was in some places less than 50 yards (metres) wide and parts covered no more than one city block.[13]
Redistricting
[edit]2011 redistricting
[edit]The 4th district includes the Chicago community of Brighton Park, in addition to almost all of Hermosa, Lower West Side and Gage Park; parts of Albany Park, Irving Park, Avondale, Logan Square, West Town, Humboldt Park, Belmont Cragin, Austin, McKinley Park, South Lawndale, New City, West Elsdon and Archer Heights; portions of riverfront Bridgeport; the portion of North Center southwest of Clybourn Avenue; and the northwestern tip of Lincoln Park. Since the 2011 redistricting, the district also includes portions of Berwyn, Brookfield, Cicero, Lyons, Melrose Park, Riverside, River Forest, and Elmwood Park.[14]
2021 redistricting
[edit]| # | County | Seat | Population |
|---|---|---|---|
| 31 | Cook | Chicago | 5,087,072 |
| 43 | DuPage | Wheaton | 921,213 |
Cities and CDPs with 10,000 or more people
[edit]- Chicago – 2,665,039
- Cicero – 85,268
- Oak Lawn – 58,362
- Berwyn – 57,250
- Elmhurst – 45,786
- Burbank – 29,439
- Melrose Park – 24,796
- Maywood – 23,512
- Brookfield – 19,476
- Bellwood – 18,789
- Franklin Park – 18,467
- Hinsdale – 17,395
- Bridgeview – 17,027
- La Grange – 16,321
- La Grange Park – 13,475
- Northlake – 12,840
- Summit – 11,617
- Burr Ridge – 11,192
- Lyons – 10,817
- River Grove – 10,612
2,500 – 10,000 people
[edit]- Riverside – 9,298
- Clarendon Hills – 8,702
- Oak Brook – 8,163
- North Riverside – 7,426
- Stickney – 7,110
- Berkeley – 5,338
- Stone Park – 4,576
Due to the 2020 redistricting, this district will be primarily based around Chicago's Southwest Side and central Cook County, as well as a portion of eastern DuPage.
The 4th district takes in the Chicago neighborhoods of Brighton Park, West Elsdon, and South Lawndale; most of New City, Pilsen, and Chicago Lawn; the part of Clearing east of S Austin Ave and W Austin Ave; eastern Garfield Ridge; and half of Bridgeport west of S Halsted St.
Outside the Chicago city limits, this district takes in the Cook County communities of Brookfield, Burbank, Berwyn, Cicero, Brookfield, Forest View, Lyons, Hinsdale (shared with DuPage County), Melrose Park, Northlake, McCook, Riverside, Stickney, Stone Park, and Summit; most of Berkeley; the portion of Franklin Park south of Franklin Ave; and part of Bellwood, Bridgeview, Burr Ridge, La Grange, La Grange Park, Maywood, North Riverside, Oak Lawn, and River Grove.
DuPage County is split between this district and the 6th district. They are partitioned by Illinois Highway 64, York St, Euclid Ave, Illinois Highway 38, Illinois Highway 83, West 22nd St, Kingston Dr, Regent Drive, 31st St, Kingey Highway, East Ogden Ave, Naperville Rd, Middaugh Rd, West Chicago Ave, North Prospect Ave, Walker Ave, 55th St, and 59th St.The 4th district takes in the municipalities of Hinsdale (shared with Cook County); and part of Clarendon Hills, Elmhurst, and Oak Brook.
Presidential election results
[edit]- This table indicates how the district has voted in U.S. presidential elections; election results reflect voting in the district as it was configured at the time of the election, not as it is configured today.
| Year | Office | Results |
|---|---|---|
| 2000 | President | Al Gore 76% - George W. Bush 19% |
| 2004 | President | John Kerry 79% - George W. Bush 21% |
| 2008 | President | Barack Obama 81% - John McCain 18% |
| 2012 | President | Barack Obama 81% - Mitt Romney 17% |
| 2016 | President | Hillary Clinton 82% - Donald Trump 13% |
| 2020 | President | Joe Biden 81% - Donald Trump 17% |
| 2024 | President | Kamala Harris 63% - Donald Trump 35% |
Recent election results from statewide races
[edit]- This table indicates how the district has voted in recent statewide elections; election results reflect voting in the district as it is currently configured, not necessarily as it was at the time of these elections.
| Year | Office | Results |
|---|---|---|
| 2016 | President | Hillary Clinton 72.4% – Donald Trump 21.7% |
| Senate | Tammy Duckworth 68.7% – Mark Kirk 24.9% | |
| 2018 | Governor | J. B. Pritzker 70.5% – Bruce Rauner 25.2% |
| Attorney General | Kwame Raoul 69.3% – Erika Harold 27.9% | |
| Secretary of State | Jesse White 81.3% – Jason Helland 15.7% | |
| 2020 | President | Joe Biden 72.3% – Donald Trump 25.9% |
| Senate | Dick Durbin 69.4% – Mark Curran 21.9% | |
| 2022 | Senate | Tammy Duckworth 70.0% – Kathy Salvi 28.2% |
| Governor | J. B. Pritzker 68.5% – Darren Bailey 28.7% | |
| Attorney General | Kwame Raoul 68.0% – Tom DeVore 29.3% | |
| Secretary of State | Alexi Giannoulias 68.9% – Dan Brady 28.7% |
Prominent representatives
[edit]| Representative | Notes |
|---|---|
 John Wentworth |
Elected the 21st Mayor of Chicago (1860 – 1861) |
 William Kellogg |
Appointed Chief Justice of the Territorial Supreme Court of the Nebraska Territory (1865 – 1867) |
 John B. Hawley |
Served as a captain for the Union Army during the American Civil War |
 Daniel W. Mills |
Served as a captain for the Union Army during the American Civil War |
 Stephen A. Hurlbut |
Served as a major general for the Union Army during the American Civil War (1861 – 1865) Appointed Minister Resident to the United States of Colombia (1869 – 1872) Appointed Envoy Extraordinary and Minister Plenipotentiary to Peru (1881 – 1882) |
 Walter C. Newberry |
Served as a brigadier general for the Union Army during the American Civil War (1861 – 1865) |
 Abner C. Harding |
Served as a brigadier general for the Union Army during the American Civil War (1862 – 1863) |
 George M. O'Brien |
Served as a lieutenant colonel for the U.S. Army Air Force during World War II (1941 – 1945) |
List of members representing the district
[edit]Election results
[edit]2012
[edit]| Party | Candidate | Votes | % | |
|---|---|---|---|---|
| Democratic | Luis Gutiérrez (incumbent) | 133,226 | 83.0 | |
| Republican | Héctor Concepción | 27,279 | 17.0 | |
| Independent | Ymelda Viramontes | 4 | 0.0 | |
| Total votes | 160,509 | 100.0 | ||
| Democratic hold | ||||
2014
[edit]| Party | Candidate | Votes | % | |
|---|---|---|---|---|
| Democratic | Luis Gutiérrez (incumbent) | 79,666 | 78.1 | |
| Republican | Hector Concepción | 22,278 | 21.9 | |
| Total votes | 101,944 | 100.0 | ||
| Democratic hold | ||||
2016
[edit]| Party | Candidate | Votes | % | |
|---|---|---|---|---|
| Democratic | Luis Gutiérrez (incumbent) | 171,297 | 100.0 | |
| Total votes | 171,297 | 100.0 | ||
| Democratic hold | ||||
2018
[edit]| Party | Candidate | Votes | % | |
|---|---|---|---|---|
| Democratic | Jesús "Chuy" García | 143,895 | 86.6 | |
| Republican | Mark Lorch | 22,294 | 13.4 | |
| Total votes | 166,189 | 100.0 | ||
| Democratic hold | ||||
2020
[edit]| Party | Candidate | Votes | % | ±% | |
|---|---|---|---|---|---|
| Democratic | Jesús "Chuy" García (incumbent) | 187,219 | 84.05 | −2.54% | |
| Republican | Jesus E. Solorio Jr. | 35,518 | 15.95 | +2.54% | |
| Total votes | 222,737 | 100.0 | |||
| Democratic hold | |||||
2022
[edit]| Party | Candidate | Votes | % | |
|---|---|---|---|---|
| Democratic | Jesús "Chuy" García (incumbent) | 91,036 | 68.42 | |
| Republican | James Falakos | 37,352 | 28.07 | |
| Working Class | Edward Hershey | 4,605 | 3.46 | |
| Write-in | 54 | 0.041 | ||
| Total votes | 133,047 | 100.0 | ||
| Democratic hold | ||||
2024
[edit]| Party | Candidate | Votes | % | ±% | |
|---|---|---|---|---|---|
| Democratic | Jesús "Chuy" García (incumbent) | 143,559 | 64.3 | −4.12% | |
| Republican | Jesus E. Solorio Jr. | 68,323 | 30.6 | +2.53% | |
| Working Class | Edward Hershey | 11,418 | 5.1 | +1.64% | |
| Total votes | 223,300 | 100.0 | |||
| Democratic hold | |||||
See also
[edit]- Illinois's congressional districts
- List of United States congressional districts
- Gerrymandering
- United States House of Representatives elections in Illinois, 2006
- United States House of Representatives elections in Illinois, 2008
- United States House of Representatives elections in Illinois, 2010
- United States House of Representatives elections in Illinois, 2012
- United States House of Representatives elections in Illinois, 2014
- United States House of Representatives elections in Illinois, 2016
References
[edit]- ^ "My Congressional District".
- ^ "2022 Cook PVI: District Map and List". Cook Political Report. July 12, 2022. Retrieved January 10, 2023.
- ^ Pearson, Rick; Byrne, John (November 28, 2017). "U.S. Rep. Luis Gutierrez won't run again, wants to rebuild Puerto Rico". ChicagoTribune. Chicago. Retrieved November 28, 2017.
- ^ Korecki, Natasha (November 27, 2017). "Gutierrez won't seek reelection". Politico. Arlington, VA. Retrieved November 27, 2017.
- ^ The Economist (April 25, 2002). "How to rig an election".
- ^ Campbell-Dollaghan, Kelsey (August 2, 2019). "The world's most revolting font is made out of gerrymandered voting districts". Fast Company. Retrieved April 6, 2021.
- ^ Aaron Blake (July 27, 2011). "Name that district! (Gerrymandering edition)". Washington Post. Retrieved July 28, 2011.
- ^ "Congressional Districts by Land Area (National)". United States Census Bureau. Archived from the original (ASCII text) on July 14, 2007. Retrieved November 11, 2006.
- ^ Parson, Stanley B., William W. Beach and Michael J. Durbin. United States Congressional Districts and Data, 1843–1883 (Westport: Greenwood Press, 1986) p. 9
- ^ Hastert v. State Bd. of Elections, 777 F.Supp. 634, 638 (N.D.Ill.1991).
- ^ O'Grady, Patrick. "Illinois Redistricting History Since 1970" (PDF). Illinois General Assembly. p. 9. Retrieved January 10, 2019.
- ^ James R. KING, v. State Bd. of Elections et al.. See [1]; [2]
- ^ John N. Friedman; Richard T. Holden. "The Rising Incumbent Reelection Rate: What'sGerrymandering Got to Do With It?". ResearchGate. The Journal of Politics. p. 5. Retrieved January 18, 2020.
- ^ Illinois Congressional District 4 Archived August 17, 2012, at the Wayback Machine, Illinois Board of Elections
- ^ "2012 General Election Official Vote Totals" (PDF). Illinois State Board of Elections. Archived from the original (PDF) on November 19, 2013. Retrieved March 26, 2012.
- ^ "Illinois General Election 2014". Archived from the original on March 6, 2018.
- ^ "Illinois General Election 2016". Archived from the original on March 27, 2019.
- ^ "2018 General Election Official Vote Totals Book".
- ^ "Election Results 2020 GENERAL ELECTION". Illinois State Board of Elections. December 4, 2020. Retrieved December 4, 2020.
- ^ "Illinois 2020 Election Results". Chicago Sun-Times. November 20, 2020. Retrieved November 20, 2020.
- Martis, Kenneth C. (1989). The Historical Atlas of Political Parties in the United States Congress. New York: Macmillan Publishing Company.
- Martis, Kenneth C. (1982). The Historical Atlas of United States Congressional Districts. New York: Macmillan Publishing Company.
- Congressional Biographical Directory of the United States 1774–present
External links
[edit]- Washington Post page on the 4th District of Illinois
- U.S. Census Bureau – 4th District Fact Sheet Archived July 17, 2011, at the Wayback Machine
- "U.S. Census Bureau – 4th District map" (PDF). (1.12 MiB)


