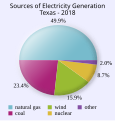
File:Texas Electricity Generation Sources Pie Chart.svg
Appearance

Size of this PNG preview of this SVG file: 342 × 358 pixels. Other resolutions: 229 × 240 pixels | 459 × 480 pixels | 734 × 768 pixels | 978 × 1,024 pixels | 1,956 × 2,048 pixels.
Original file (SVG file, nominally 342 × 358 pixels, file size: 3 KB)
File history
Click on a date/time to view the file as it appeared at that time.
| Date/Time | Thumbnail | Dimensions | User | Comment | |
|---|---|---|---|---|---|
| current | 01:29, 3 April 2019 |  | 342 × 358 (3 KB) | Aflafla1 | Update to reflect 2018 generation. Increased natural gas and wind. decreased coal. |
| 20:52, 29 July 2018 |  | 342 × 358 (3 KB) | Aflafla1 | update for 2017 data | |
| 02:34, 10 March 2017 |  | 342 × 358 (3 KB) | Aflafla1 | User created page with UploadWizard |
File usage
The following page uses this file:
