
File:Most common birthdays.svg

Original file (SVG file, nominally 512 × 768 pixels, file size: 111 KB)
| This is a file from the Wikimedia Commons. Information from its description page there is shown below. Commons is a freely licensed media file repository. You can help. |
Summary
| Description |
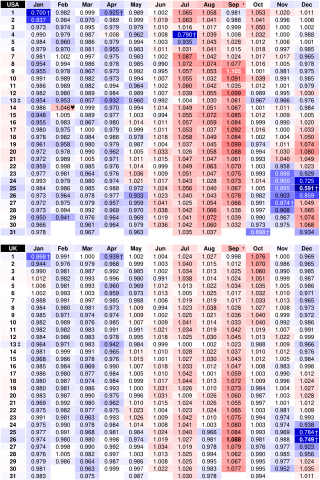
Heat map of the birth ratio of each day to the average in the USA for people born from 1994 to 1999 according to the Center for Disease Control and 2000 to 2014 according to the Social Security Administration (top), and in Wales and England for people born from 1995 to 2014 according to the Office for National Statistics (bottom), also aggregated by month and day of month with 29 February normalised, and minima and maxima in bold by CMG Lee. * Most common birthdays are in September. † Least common birthdays fall around Christmas, New Year's and April Fools' Days, plus in the USA, Independence Day, Hallowe'en and Thanksgiving. ‡ The 13th of each month has fewer birthdays than adjacent days. ♥ Valentine's Day is overrepresented in the USA. There is a weak weekly cycle due to the small number of years taken, but overall, England and Wales have a more uniform distribution. Data is from http://github.com/fivethirtyeight/data/tree/master/births and http://ons.gov.uk/peoplepopulationandcommunity/birthsdeathsandmarriages/livebirths/articles/howpopularisyourbirthday/2015-12-18 . In the SVG file, hover over a date to highlight it on both tables. |
| Source | Own work |
| Author | Cmglee |
Licensing
- You are free:
- to share – to copy, distribute and transmit the work
- to remix – to adapt the work
- Under the following conditions:
- attribution – You must give appropriate credit, provide a link to the license, and indicate if changes were made. You may do so in any reasonable manner, but not in any way that suggests the licensor endorses you or your use.
- share alike – If you remix, transform, or build upon the material, you must distribute your contributions under the same or compatible license as the original.

|
Permission is granted to copy, distribute and/or modify this document under the terms of the GNU Free Documentation License, Version 1.2 or any later version published by the Free Software Foundation; with no Invariant Sections, no Front-Cover Texts, and no Back-Cover Texts. A copy of the license is included in the section entitled GNU Free Documentation License. |
File history
Click on a date/time to view the file as it appeared at that time.
| Date/Time | Thumbnail | Dimensions | User | Comment | |
|---|---|---|---|---|---|
| current | 21:50, 16 March 2021 | | 512 × 768 (111 KB) | Cmglee | {{Information |Description=Heat map of the birth ratio of each day to the average in the USA for people born from 1994 to 1999 according to the Center for Disease Control and 2000 to 2014 according to the Social Security Administration (top), and in Wales and England for people born from 1995 to 2014 according to the Office for National Statistics (bottom), also aggregated by month and day of month with 29 February normalised, and minima and maxima in bold by CMG Lee. * Most common birthdays... |
File usage
The following 2 pages use this file:
Global file usage
The following other wikis use this file:
- Usage on fr.wikipedia.org
- Usage on sr.wikipedia.org