
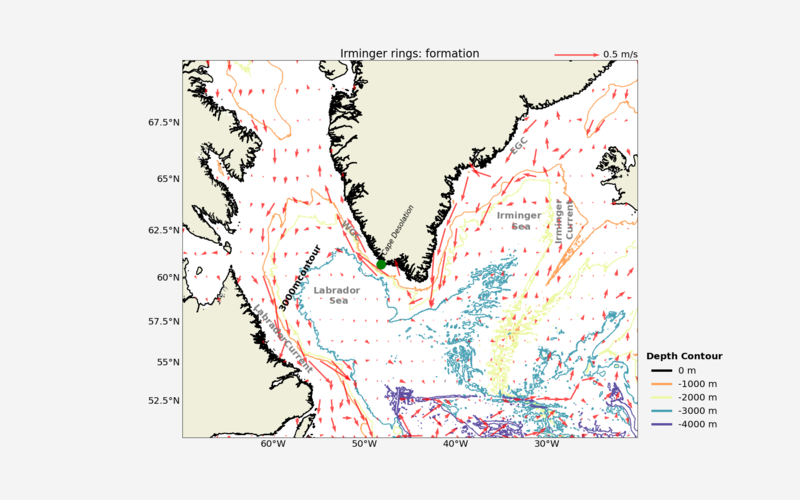
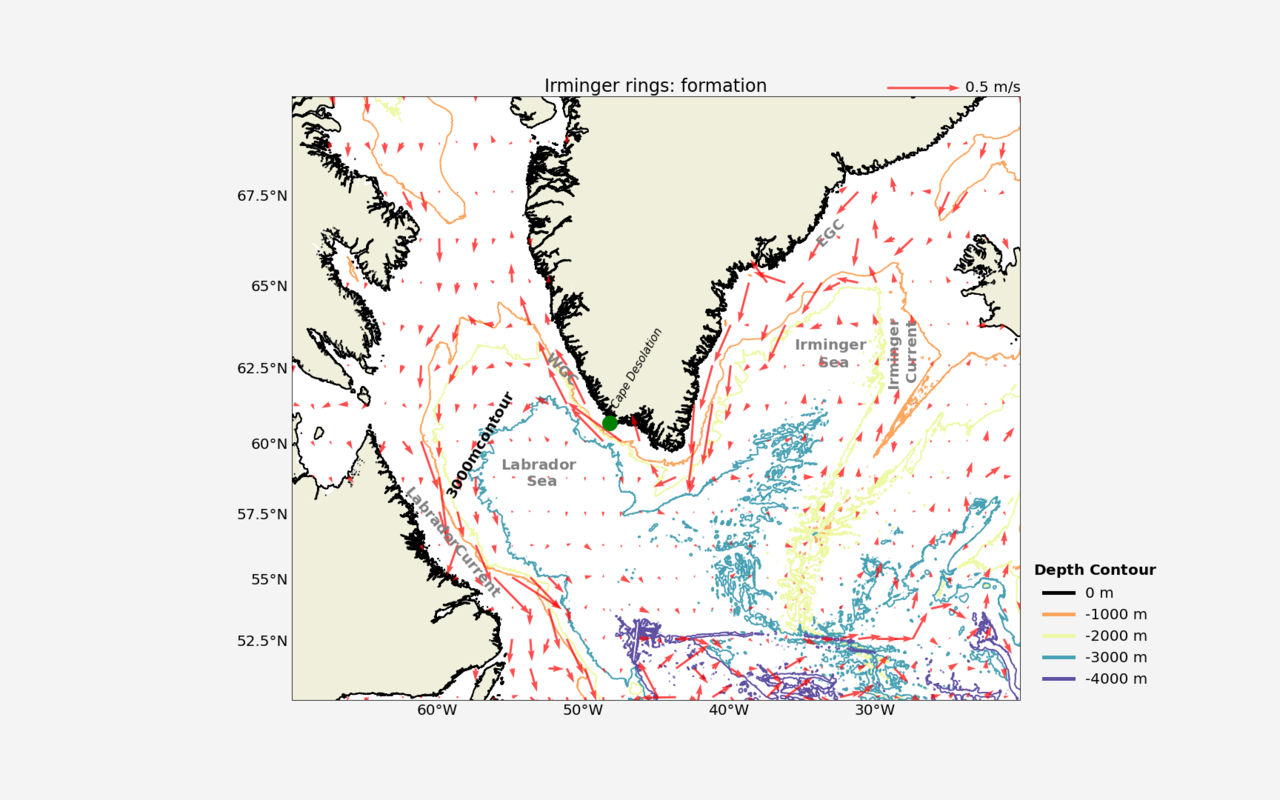
File:Map of the Labrador & Irminger seas. With depth contours and current data.png

Size of this preview: 800 × 500 pixels. Other resolutions: 320 × 200 pixels | 640 × 400 pixels | 1,024 × 640 pixels | 1,280 × 800 pixels | 1,728 × 1,080 pixels.
Original file (1,728 × 1,080 pixels, file size: 514 KB, MIME type: image/png)
| This is a file from the Wikimedia Commons. Information from its description page there is shown below. Commons is a freely licensed media file repository. You can help. |
Summary
| Description |
English: Map of the Labarador and irminger seas, with current data and depth contours. Cape desolation marks the position where the irminger rings are formed. The bathymetry data is a courtesy of the General Bathymetric chart of the ocean (GEBCO Compilation Group (2021) GEBCO 2021 Grid (doi:10.5285/c6612cbe-50b3-0cff�e053-6c86abc09f8f)). The current data shown on the figure was retrieved from the CMEMS database (https://doi.org/10.48670/moi-00049). |
| Date | |
| Source | Own work |
| Author | JimRegtien |
Licensing
I, the copyright holder of this work, hereby publish it under the following license:
This file is licensed under the Creative Commons Attribution-Share Alike 4.0 International license.
- You are free:
- to share – to copy, distribute and transmit the work
- to remix – to adapt the work
- Under the following conditions:
- attribution – You must give appropriate credit, provide a link to the license, and indicate if changes were made. You may do so in any reasonable manner, but not in any way that suggests the licensor endorses you or your use.
- share alike – If you remix, transform, or build upon the material, you must distribute your contributions under the same or compatible license as the original.
File history
Click on a date/time to view the file as it appeared at that time.
| Date/Time | Thumbnail | Dimensions | User | Comment | |
|---|---|---|---|---|---|
| current | 14:18, 7 April 2022 | | 1,728 × 1,080 (514 KB) | JimRegtien | Changed legend. |
| 10:22, 7 April 2022 |  | 1,728 × 1,080 (520 KB) | JimRegtien | Updated version | |
| 10:11, 7 April 2022 |  | 1,728 × 1,080 (511 KB) | JimRegtien | {{Information |Description= Map of the Labarador and irminger seas, with current data and depth contours. Cape desolation marks the position where the irminger rings are formed. The bathymetry data is a courtesy of the General Bathymetric chart of the ocean (GEBCO Compilation Group (2021) GEBCO 2021 Grid (doi:10.5285/c6612cbe-50b3-0cff�e053-6c86abc09f8f)). The current data shown on the figure was retrieved from the CMEMS database (https://doi.org/10.48670/moi-00049). |Source= Own Work |Date=7... | |
| 21:36, 24 March 2022 |  | 1,200 × 900 (507 KB) | User-duck | Cropped tighter using CropTool with lossless mode. | |
| 17:30, 24 March 2022 |  | 1,728 × 1,080 (519 KB) | JimRegtien | Uploaded own work with UploadWizard |
File usage
The following pages on the English Wikipedia use this file (pages on other projects are not listed):