File:CDTA System Map 2010-03.png

Original file (3,005 × 3,005 pixels, file size: 368 KB, MIME type: image/png)
Summary
[edit]| Description |
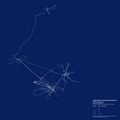
CDTA system map showing service frequency, based on GTFS data from November 2009 to March 2010 (http://cdta.org/schedules_developer_tools_google_transit.php). This map excludes school routes, college shuttles, NX, and routes running less than five days per week (most rural routes). Source: http://www.jonhehir.com/cdta/intro.html |
|---|---|
| Source | |
| Date |
02:58, 28 February 2010 (UTC) |
| Author | |
| Permission (Reusing this file) |
See below.
|
Licensing
[edit]| I, the copyright holder of this work, hereby release it into the public domain. This applies worldwide. If this is not legally possible: |
 | This file is a candidate to be copied to Wikimedia Commons.
Any user may perform this transfer; refer to Wikipedia:Moving files to Commons for details. If this file has problems with attribution, copyright, or is otherwise ineligible for Commons, then remove this tag and DO NOT transfer it; repeat violators may be blocked from editing. Other Instructions
| ||
| |||
File history
Click on a date/time to view the file as it appeared at that time.
| Date/Time | Thumbnail | Dimensions | User | Comment | |
|---|---|---|---|---|---|
| current | 18:22, 28 February 2010 |  | 3,005 × 3,005 (368 KB) | Youngtwig (talk | contribs) | Reverted to key-less version (key is inaccurate) |
| 17:54, 28 February 2010 |  | 3,005 × 3,005 (426 KB) | Youngtwig (talk | contribs) | Added key, included SUNY and RPI shuttle | |
| 02:58, 28 February 2010 |  | 3,005 × 3,005 (368 KB) | Youngtwig (talk | contribs) | {{Information |Description = Frequency-adjusted CDTA system map, based on GTFS data from November 2009 to March 2010 (http://cdta.org/schedules_developer_tools_google_transit.php). |Source = I (~~~) created this work entirely by myself. |
You cannot overwrite this file.
File usage
The following page uses this file:
