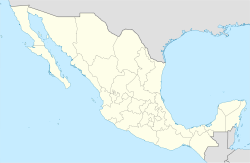
Cuautitlán de García Barragán
Appearance
(Redirected from Cuautitlan de Garcia Barragan)
Cuautitlán de García Barragán | |
|---|---|
Municipality and town | |
 Location of the municipality in Jalisco | |
| Coordinates: 19°27′08″N 104°21′30″W / 19.45222°N 104.35833°W | |
| Country | |
| State | Jalisco |
| Area | |
• Total | 1,391 km2 (537 sq mi) |
| • Town | 1.37 km2 (0.53 sq mi) |
| Population (2020 census)[1] | |
• Total | 18,370 |
| • Density | 13/km2 (34/sq mi) |
| • Town | 2,794 |
| • Town density | 2,000/km2 (5,300/sq mi) |
Cuautitlán de García Barragán is a town and municipality in Jalisco in central-western Mexico. The municipality covers an area of 1,391 km².
As of 2005, the municipality had a total population of 16,408.[2]
Climate
[edit]| Climate data for Cuautitlán De García Barragán (1991–2020 normals, extremes 1965–present) | |||||||||||||
|---|---|---|---|---|---|---|---|---|---|---|---|---|---|
| Month | Jan | Feb | Mar | Apr | May | Jun | Jul | Aug | Sep | Oct | Nov | Dec | Year |
| Record high °C (°F) | 47 (117) |
46 (115) |
43.5 (110.3) |
44.5 (112.1) |
45 (113) |
44.5 (112.1) |
43.5 (110.3) |
44 (111) |
45.5 (113.9) |
44 (111) |
44.5 (112.1) |
46.5 (115.7) |
47 (117) |
| Mean daily maximum °C (°F) | 34.6 (94.3) |
35.7 (96.3) |
37.2 (99.0) |
38.9 (102.0) |
39.4 (102.9) |
36.4 (97.5) |
34.8 (94.6) |
34.4 (93.9) |
33.9 (93.0) |
34.5 (94.1) |
35.0 (95.0) |
34.2 (93.6) |
35.8 (96.4) |
| Daily mean °C (°F) | 25.6 (78.1) |
26.0 (78.8) |
26.6 (79.9) |
28.2 (82.8) |
30.1 (86.2) |
30.3 (86.5) |
29.3 (84.7) |
29.2 (84.6) |
28.9 (84.0) |
29.0 (84.2) |
27.8 (82.0) |
25.8 (78.4) |
28.1 (82.6) |
| Mean daily minimum °C (°F) | 16.5 (61.7) |
16.3 (61.3) |
16.0 (60.8) |
17.4 (63.3) |
20.7 (69.3) |
24.3 (75.7) |
23.9 (75.0) |
24.0 (75.2) |
23.9 (75.0) |
23.4 (74.1) |
20.6 (69.1) |
17.4 (63.3) |
20.4 (68.7) |
| Record low °C (°F) | 0.5 (32.9) |
1.5 (34.7) |
1 (34) |
5 (41) |
8 (46) |
4.5 (40.1) |
13.5 (56.3) |
13.5 (56.3) |
13 (55) |
3.5 (38.3) |
6.5 (43.7) |
0.5 (32.9) |
0.5 (32.9) |
| Average precipitation mm (inches) | 26.6 (1.05) |
16.3 (0.64) |
11.3 (0.44) |
0.2 (0.01) |
11.9 (0.47) |
243.3 (9.58) |
343.6 (13.53) |
360.2 (14.18) |
393.6 (15.50) |
237.3 (9.34) |
51.6 (2.03) |
14.3 (0.56) |
1,710.2 (67.33) |
| Average precipitation days | 2.5 | 1.9 | 0.7 | 0.2 | 2.4 | 17.5 | 24.6 | 25.1 | 24.8 | 17.4 | 4.9 | 2.2 | 124.2 |
| Source: Servicio Meteorológico Nacional[3][4] | |||||||||||||
References
[edit]- ^ Citypopulation.de
- ^ "Cuautitlán de García Barragán". Enciclopedia de los Municipios de México. Instituto Nacional para el Federalismo y el Desarrollo Municipal. Archived from the original on May 30, 2007. Retrieved April 13, 2009.
- ^ "NORMAL CLIMATOLÓGICA 1991-2020" (TXT). Servicio Meteorológico Nacional. Archived from the original on 4 January 2025. Retrieved 4 January 2025.
- ^ "VALORES EXTREMOS" (TXT). Servicio Meteorológico Nacional. Archived from the original on 4 January 2025. Retrieved 4 January 2025.


