Climate classification

Climate classifications are systems that categorize the world's climates. A climate classification may correlate closely with a biome classification, as climate is a major influence on life in a region. One of the most used is the Köppen climate classification scheme first developed in 1884.[1]
There are several ways to classify climates into similar regimes. Originally, climes were defined in Ancient Greece to describe the weather depending upon a location's latitude. Modern climate classification methods can be broadly divided into genetic methods, which focus on the causes of climate, and empiric methods, which focus on the effects of climate. Examples of genetic classification include methods based on the relative frequency of different air mass types or locations within synoptic weather disturbances. Examples of empiric classifications include climate zones defined by plant hardiness,[2] evapotranspiration,[3] or associations with certain biomes, as in the case of the Köppen climate classification. A common shortcoming of these classification schemes is that they produce distinct boundaries between the zones they define, rather than the gradual transition of climate properties more common in nature.
Types of climate
[edit]- Alpine climate
- Desert climate or arid climate
- Humid continental climate
- Humid subtropical climate
- Ice cap climate
- Oceanic climate
- Subarctic climate
- Semi-arid climate
- Mediterranean climate
- Tropical monsoon climate
- Tropical rainforest climate
- Tropical savanna climate
- Tundra climate
- Polar climate
Systems
[edit]
Climate classification systems include:
- Aridity index – part of many systems
- Alisov climate classification (ru)
- Berg climate classification
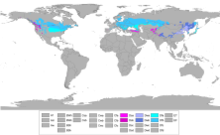
- Köppen climate classification – most widely used in the 1954 Köppen–Geiger variant
- Holdridge life zone classification – relatively simple
- Lauer climate classification
- Strahler climate classification
- Thornthwaite climate classification
- Trewartha climate classification – 1967 modification of Köppen
- Troll climate classification
- Vahl climate classification
- Zhou climate classification (zh)
Bergeron and Spatial Synoptic
[edit]The simplest classification is that involving air masses. The Bergeron classification is the most widely accepted form of air mass classification.[4] Air mass classification involves three letters. The first letter describes its moisture properties, with c used for continental air masses (dry) and m for maritime air masses (moist). The second letter describes the thermal characteristic of its source region: T for tropical, P for polar, A for Arctic or Antarctic, M for monsoon, E for equatorial, and S for superior air (dry air formed by significant downward motion in the atmosphere). The third letter is used to designate the stability of the atmosphere. If the air mass is colder than the ground below it, it is labeled k. If the air mass is warmer than the ground below it, it is labeled w.[5] While air mass identification was originally used in weather forecasting during the 1950s, climatologists began to establish synoptic climatologies based on this idea in 1973.[6]
Based upon the Bergeron classification scheme is the Spatial Synoptic Classification system (SSC). There are six categories within the SSC scheme: Dry Polar (similar to continental polar), Dry Moderate (similar to maritime superior), Dry Tropical (similar to continental tropical), Moist Polar (similar to maritime polar), Moist Moderate (a hybrid between maritime polar and maritime tropical), and Moist Tropical (similar to maritime tropical, maritime monsoon, or maritime equatorial).[7]
Köppen
[edit]

The Köppen classification depends on average monthly values of temperature and precipitation. The most commonly used form of the Köppen classification has five primary types labeled A through E. These primary types are A) tropical, B) dry, C) mild mid-latitude, D) cold mid-latitude, and E) polar.
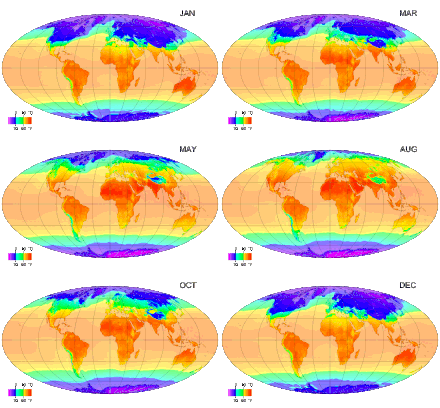
Tropical climates are defined as locations where the coolest monthly mean temperature is above 18 C (64.4 F). This tropical zone is further broken down into rainforest, monsoon, and savanna based on seasonal rainfall. These climates are most often located between the Equator and 25 north and south latitude.
A monsoon is a seasonal prevailing wind which lasts for several months, ushering in a region's rainy season.[8] Regions within North America, South America, Sub-Saharan Africa, Australia and East Asia are monsoon regimes.[9]

A tropical savanna is a grassland biome located in semi-arid to semi-humid climate regions of subtropical and tropical latitudes, with average temperatures remaining at or above 18 °C (64 °F) all year round, and rainfall between 750 millimetres (30 in) and 1,270 millimetres (50 in) a year. They are widespread on Africa, and are found in India, the northern parts of South America, Malaysia, and Australia.[11]

The humid subtropical climate zone where winter rainfall (and sometimes light snowfall) is associated with storms that the westerlies steer from west to east at the time of low sun (winter). In summer, high pressure dominates as the westerlies move north. Most summer rainfall occurs during thunderstorms and from occasional tropical cyclones.[14] Humid subtropical climates lie on the east side of continents, roughly between latitudes 20° and 40° degrees away from the equator.[15]

A humid continental climate is marked by variable weather patterns and a large seasonal temperature variance, cold and often very snowy winters, and warm summers. Places with more than three months of average daily temperatures above 10 °C (50 °F) and a coldest month temperature below −3 °C (27 °F) and which do not meet the criteria for an arid or semi-arid climate, are classified as continental. Most climates in this zone are found from 35 latitude to 55 latitude, mostly in the northern hemisphere.[16]
An oceanic climate is typically found along west coasts in higher middle latitudes of all the world's continents, and in southeastern Australia, and is accompanied by plentiful precipitation year-round, cool summers, and small annual ranges of temperatures. Most climates of this type are found from 45 latitude to 55 latitude.[17]
The Mediterranean climate regime resembles the climate of the lands in the Mediterranean Basin, parts of western North America, parts of Western and South Australia, in southwestern South Africa and in parts of central Chile. The climate is characterized by hot, dry summers and cool, wet winters.[18]
A steppe is a dry grassland with an annual temperature range in the summer of up to 40 °C (104 °F) and during the winter down to −40 °C (−40 °F).[19]
A subarctic climate has little precipitation,[20] and monthly temperatures which are above 10 °C (50 °F) for one to three months of the year, with permafrost in large parts of the area due to the cold winters. Winters within subarctic climates usually include up to six months of temperatures averaging below 0 °C (32 °F).[21]

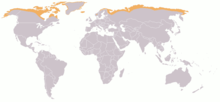
Tundra occurs in the far Northern Hemisphere, north of the taiga belt, including vast areas of northern Russia and Canada.[22]
A polar ice cap, or polar ice sheet, is a high-latitude region of a planet or moon that is covered in ice. Ice caps form because high-latitude regions receive less energy as solar radiation from the sun than equatorial regions, resulting in lower surface temperatures.[23]
A desert is a landscape form or region that receives very little precipitation. Deserts usually have a large diurnal and seasonal temperature range, with high or low, depending on location daytime temperatures (in summer up to 45 °C or 113 °F), and low nighttime temperatures (in winter down to 0 °C or 32 °F) due to extremely low humidity. Many deserts are formed by rain shadows, as mountains block the path of moisture and precipitation to the desert.[24]
Trewartha
[edit]The Trewartha climate classification (TCC) or the Köppen–Trewartha climate classification (KTC) is a climate classification system first published by American geographer Glenn Thomas Trewartha in 1966. It is a modified version of the Köppen–Geiger system, created to answer some of its deficiencies.[25] The Trewartha system attempts to redefine the middle latitudes to be closer to vegetation zoning and genetic climate systems.
The Trewartha climate classification changes were seen as most effective on the large landmasses in Asia and North America, where many areas fall into a single group (C) in the Köppen–Geiger system.[26] For example, under the standard Köppen system, Washington and Oregon are classed into the same climate zone (Csb) as parts of Southern California, even though the two regions have strikingly different weather and vegetation. Another example was classifying cities like London or New York in the same climate group (C) as Brisbane or New Orleans, despite great differences in seasonal temperatures and native plant life.[27]
Scheme
[edit]Trewartha's modifications to the 1899 Köppen climate system sought to reclass the middle latitudes into three groups: C (subtropical)—8 or more months have a mean temperature of 10 °C (50 °F) or higher; D temperate—4 to 7 months have a mean temperature of 10 °C or higher; and E boreal climate—1 to 3 months have a mean temperature of 10 °C or higher. Otherwise, the tropical climates and polar climates remained the same as the original Köppen climate classification.
Thornthwaite
[edit]
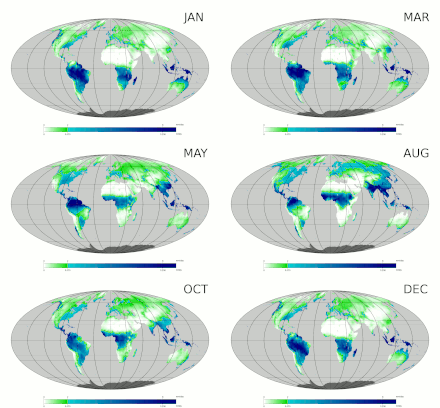
Devised by the American climatologist and geographer C. W. Thornthwaite, this climate classification method monitors the soil water budget using evapotranspiration.[28] It monitors the portion of total precipitation used to nourish vegetation over a certain area.[29] It uses indices such as a humidity index and an aridity index to determine an area's moisture regime based upon its average temperature, average rainfall, and average vegetation type.[30] The lower the value of the index in any given area, the drier the area is.
The moisture classification includes climatic classes with descriptors such as hyperhumid, humid, subhumid, subarid, semi-arid (values of −20 to −40), and arid (values below −40).[31] Humid regions experience more precipitation than evaporation each year, while arid regions experience greater evaporation than precipitation on an annual basis. A total of 33 percent of the Earth's landmass is considered either arid or semi-arid, including southwest North America, southwest South America, most of northern and a small part of southern Africa, southwest and portions of eastern Asia, as well as much of Australia.[32] Studies suggest that precipitation effectiveness (PE) within the Thornthwaite moisture index is overestimated in the summer and underestimated in the winter.[33] This index can be effectively used to determine the number of herbivore and mammal species numbers within a given area.[34] The index is also used in studies of climate change.[33]
Thermal classifications within the Thornthwaite scheme include microthermal, mesothermal, and megathermal regimes. A microthermal climate is one of low annual mean temperatures, generally between 0 °C (32 °F) and 14 °C (57 °F) which experiences short summers and has a potential evaporation between 14 centimetres (5.5 in) and 43 centimetres (17 in).[35] A mesothermal climate lacks persistent heat or persistent cold, with potential evaporation between 57 centimetres (22 in) and 114 centimetres (45 in).[36] A megathermal climate is one with persistent high temperatures and abundant rainfall, with potential annual evaporation in excess of 114 centimetres (45 in).[37]
See also
[edit]- Ecological land classification
- Biogeographical realm
- Biome
- Geographical zone
- Hardiness zone
- Mediterranean climate or dry summer climate
References
[edit]This article needs additional citations for verification. (December 2018) |
- ^ Beck, Hylke E.; Zimmermann, Niklaus E.; McVicar, Tim R.; Vergopolan, Noemi; Berg, Alexis; Wood, Eric F. (30 October 2018). "Present and future Köppen-Geiger climate classification maps at 1-km resolution". Scientific Data. 5: 180214. Bibcode:2018NatSD...580214B. doi:10.1038/sdata.2018.214. ISSN 2052-4463. PMC 6207062. PMID 30375988.
- ^ United States National Arboretum. USDA Plant Hardiness Zone Map. Archived 2012-07-04 at the Wayback Machine Retrieved on 2008-03-09
- ^ "Thornthwaite Moisture Index". Glossary of Meteorology. American Meteorological Society. Retrieved 21 May 2008.
- ^ Field behavior of chemical, biological, and radiological agents. Dept. of Defense Depts. of the Army and the Air Force. 1969.
- ^ "Airmass Classification". Glossary of Meteorology. American Meteorological Society. Retrieved 22 May 2008.
- ^ Schwartz, M.D. (1995). "Detecting Structural Climate Change: An Air Mass-Based Approach in the North Central United States, 1958–1992". Annals of the Association of American Geographers. 85 (3): 553–68. doi:10.1111/j.1467-8306.1995.tb01812.x.
- ^ Robert E. Davis, L. Sitka, D. M. Hondula, S. Gawtry, D. Knight, T. Lee, and J. Stenger. J1.10 A preliminary back-trajectory and air mass climatology for the Shenandoah Valley (Formerly J3.16 for Applied Climatology). Retrieved on 2008-05-21.
- ^ "Monsoon". Glossary of Meteorology. American Meteorological Society. Retrieved 14 May 2008.
- ^ "The Global Monsoon System: Research and Forecast" (PDF). International Committee of the Third Workshop on Monsoons. Archived from the original (PDF) on 8 April 2008. Retrieved 16 March 2008.
- ^ Central, Brian. "The Bright Side of 13 Years of Clouds in 1 Map". Scientific American. Retrieved 17 May 2015.
- ^ Woodward, Susan. "Tropical Savannas". Archived from the original on 25 February 2008. Retrieved 16 March 2008.
- ^ "Cloud Fraction (1 month – Terra/MODIS) – NASA". Cloud Fraction (1 month – Terra/MODIS) – NASA. Retrieved 18 May 2015.
- ^ Central, Brian. "The Bright Side of 13 Years of Clouds in 1 Map". Scientific American. Retrieved 18 May 2015.
- ^ "Humid subtropical climate". Encyclopædia Britannica. Encyclopædia Britannica Online. 2008. Retrieved 14 May 2008.
- ^ Ritter, Michael. Humid Subtropical Climate. Archived from the original on 14 October 2008. Retrieved 16 March 2008.
- ^ Peel, M. C.; Finlayson B. L. & McMahon, T. A. (2007). "Updated world map of the Köppen-Geiger climate classification". Hydrol. Earth Syst. Sci. 11 (5): 1633–1644. Bibcode:2007HESS...11.1633P. doi:10.5194/hess-11-1633-2007. ISSN 1027-5606.
- ^ "Oceanic Climate". Archived from the original on 9 February 2011. Retrieved 15 April 2008.
- ^ Ritter, Michael. Mediterranean or Dry Summer Subtropical Climate. Archived from the original on 5 August 2009. Retrieved 15 April 2008.
- ^ Steppe Climate. Blue Planet Biomes. Archived from the original on 22 April 2008. Retrieved 15 April 2008.
- ^ Ritter, Michael. Subarctic Climate. Archived from the original on 25 May 2008. Retrieved 16 April 2008.
- ^ Woodward, Susan. "Taiga or Boreal Forest". Archived from the original on 9 June 2011. Retrieved 6 June 2008.
- ^ "The Tundra Biome". The World's Biomes. Retrieved 5 March 2006.
- ^ Ritter, Michael. Ice Cap Climate. Archived from the original on 16 May 2008. Retrieved 16 March 2008.
- ^ Introduction to Arid Regions: A Self-Paced Tutorial. San Diego State University. Archived from the original on 12 June 2008. Retrieved 16 April 2008.
- ^ Peel MC, Finlayson BL, McMahon TA (2007) Updated world map of the Köppen-Geiger climate classification. Hydrol Earth Syst Sci 11: 1633–1644
- ^ Köppen, 1936, Trewartha & Horn 1980, Bailey 2009, Baker et al. 2010
- ^ Bailey RG (2009) Ecosystem geography:from ecoregions to sites, 2nd edn. Springer, New York, NY
- ^ Glossary of Meteorology. Thornthwaite Moisture Index. Retrieved on 2008-05-21.
- ^ "Moisture Index". Glossary of Meteorology. American Meteorological Society. Retrieved 21 May 2008.
- ^ Green, Eric. "Foundations of Expansive Clay Soil" (PDF). Archived from the original (Part 1 – The Science of Expansive Clay) on 27 May 2008.
- ^ "3 Land Resources". Istituto Agronomico per l'Otremare. Archived from the original on 20 March 2008. Retrieved 21 May 2008.
- ^ Fredlund, D.G.; Rahardjo, H. (1993). Soil Mechanics for Unsaturated Soils (PDF). Wiley-Interscience. ISBN 978-0-471-85008-3. OCLC 26543184. Retrieved 21 May 2008.
- ^ a b McCabe, Gregory J.; Wolock, David M. (12 February 2002). "Trends and temperature sensitivity of moisture conditions in the conterminous United States" (PDF). Climate Research. 20: 19–29. Retrieved 21 May 2008.
- ^ Hawkins, B.A.; Pausas, Juli G. (2004). "Does plant richness influence animal richness?: the mammals of Catalonia (NE Spain)". Diversity & Distributions. 10 (4): 247–252. Bibcode:2004DivDi..10..247H. doi:10.1111/j.1366-9516.2004.00085.x. S2CID 55240915. Retrieved 21 May 2008.
- ^ "Microthermal Climate". Glossary of Meteorology. American Meteorological Society. Retrieved 21 May 2008.
- ^ "Mesothermal Climate". Glossary of Meteorology. American Meteorological Society. Retrieved 21 May 2008.
- ^ "Megathermal Climate". Glossary of Meteorology. American Meteorological Society. Retrieved 21 May 2008.
