Jump to content

California's 3rd congressional district

Coordinates: 38°54′N 122°00′W / 38.9°N 122.0°W / 38.9; -122.0
From Wikipedia, the free encyclopedia
(Redirected from CA-03)

California's 3rd congressional district
Map
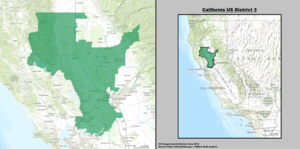
Interactive map of district boundaries since 2023 (Used in the 2022 elections)
Representative
Population (2023)788,130[1]
Median household
income
$101,591[2]
Ethnicity
Cook PVIR+4[3]

California's 3rd congressional district is a U.S. congressional district in California. It includes the northern Sierra Nevada and northeastern suburbs of Sacramento, stretching south to Death Valley. It encompasses Alpine, Inyo, Mono, Nevada, Placer (where the majority of the district’s population lives), Plumas, and Sierra counties, as well as parts of El Dorado, Sacramento, and Yuba counties. It includes the Sacramento suburbs of Roseville (the district's largest city), Folsom, Orangevale, Rocklin, Auburn, and Lincoln, along with the mountain towns of Quincy, South Lake Tahoe, Truckee, Mammoth Lakes, and Bishop.[1] The district is represented by Republican Kevin Kiley.

Prior to redistricting in 2020, the 3rd district encompassed most of the Sacramento Valley north and west of Sacramento. It covered all of Colusa, Sutter and Yuba counties, most of Glenn, Lake, Solano and Yolo counties and a portion of Sacramento County.[4] The district was represented by John Garamendi, a Democrat.

Recent election results from statewide races

[edit]
Election results from statewide races
Year Office Results
2012 President Obama (D) 54.3–43.1%
Senator Feinstein (D) 56.5–43.55
2014 Governor Brown (D) 56.0–44.0%
2016 President Clinton (D) 53.0–40.4%
Senator Harris (D) 62.4–37.6%
2018 Governor Newsom (D) 52.4–47.6%
Senator De León (D) 52.8–47.2%
2020 President Biden (D) 54.9–42.7%
2021 Recall[5] Red XN No 52.2–47.8%
2022 Governor[6] Dahle (R) 56.8–43.2%
Senator Meuser (R) 54.1–45.9%

Recent history

[edit]

The 3rd district once extended up the Sacramento Valley from Sacramento to take in rural territory up to Tehama County. Once a Democratic bastion, the district was pushed into more rural and Republican-leaning territory after the 1990 census, and finally elected a Republican in 1998. The 2001 reapportionment made the district more compact and Republican than its predecessor, though it was far less Republican than the neighboring 4th district. Although there was some movement in registration in favor of the Democrats, it still had a strong GOP flavor as most of the Sacramento area's Democratic voters lived in the neighboring 5th district.

Presidential performance

[edit]

While George W. Bush carried the district in 2004 with 58.2% of the vote, the district swung rapidly in the Democratic column in 2008 with Barack Obama narrowly winning a plurality with 49.28% of the vote over John McCain's 48.81%. However, despite Obama's win, in the congressional election held on the same day the Republicans retained the seat.

Reapportionment

[edit]

After redistricting, this district essentially became the 7th district, while a new 3rd was created with lines similar to what the old 3rd had in the 1990s. This version of the 3rd was considered a swing district, though the bulk of its population lives in Democratic-leaning areas in the outer Bay Area and in the closer-in suburbs of Sacramento.

Election results from statewide races before 2012

[edit]
Election results from statewide races
Year Office Results
1992 President Clinton (D) 40.9–37.2%
Senator Herschensohn (R) 45.2–44.2%
Senator Feinstein (D) 49.3–41.7%
1994 Governor Wilson (R) 60.2–35.1%
Senator Feinstein (D) 46.7-44.8%
1996 President Clinton (D) 45.2–44.4%
1998 Governor Davis (D) 58.0-38.4%
Senator Boxer (D) 53.1-43.0%
2000 President[7] Bush (R) 51.1–43.6%
Senator[8] Feinstein (D) 48.9–43.4%
2002 Governor[9] Simon (R) 54.5–34.0%
2003 Recall[10][11] Green tickY Yes 66.8–33.2%
Schwarzenegger (R) 58.2–20.3%
2004 President[12] Bush (R) 58.2–40.8%
Senator[13] Jones (R) 51.1–46.7%
2006 Governor[14] Schwarzenegger (R) 68.6–26.8%
Senator[15] Feinstein (D) 48.8–46.1%
2008 President[16] Obama (D) 49.3–48.8%
2010 Governor[17] Brown (D) 47.6–47.4%
Senator[18] Fiorina (R) 52.9–40.7%

Composition as of 2024

[edit]
# County Seat Population
3 Alpine Markleeville 1,141
17 El Dorado Placerville 192,215
27 Inyo Independence 18,527
51 Mono Bridgeport 13,066
57 Nevada Nevada City 102,037
61 Placer Auburn 423,561
63 Plumas Quincy 19,131
67 Sacramento Sacramento 1,584,288
91 Sierra Downieville 3,200
115 Yuba Marysville 85,722

As of the 2020 redistricting, California's 3rd congressional district is located in the Sierra Nevada region. It encompasses Alpine, Inyo, Mono, Nevada, Placer, Plumas, and Sierra Counties, as well as parts of El Dorado, Sacramento, and Yuba Counties.

Geography

[edit]

El Dorado County is split between this district and the 5th district. They are partitioned by Scott Creek, Perry Creek, Perry Creek Rd, Rocky Bar Rd, Grizzly Flat Rd, Happy Valley Rd, Canon Creek, E16 Highway, Pleasant Valley Rd, Cedar Ravine Rd, Woodland Dr, Weber Creek, Highway 50, Chili Bar Reservoir, South Fork American River, Marshall Rd, Hastings Creek, Highway 49, Pilot Creek, North Fork American River, and the Folsom Lake State Recreation Area. The 3rd district takes in the city of South Lake Tahoe and the census-designated places Auburn Lake Trails, Camino, Georgetown, Grizzly Flats, Meyers, and Pollock Pines.

Sacramento County is split between this district and both the 6th district and 7th district. The 6th and 3rd districts are partitioned by Latrobe Rd, Scott Rd, Deer Creek, Carson Creek, Nimbus Rd, E3 Highway, Illinois Ave, Madison Ave, Kenneth Ave, Wachtel Way, and Old Auburn Rd. The 3rd district takes in the city of Folsom and the census-designated place Orangevale.

Yuba County is split between this district and the 1st district. They are partitioned by State Highway 70, Ellis Rd, and Union Pacific. The 3rd district takes in the census-designated places Challenge-Brownsville, Comptonville, Dobbins, Loma Rica, and Smartsville.

Cities and CDPs with 10,000 or more people

[edit]

2,500 – 10,000 people

[edit]

List of members representing the district

[edit]
Member Party Dates Cong
ress
Electoral history Counties
District created March 4, 1865

John Bidwell
(Chico)
Republican March 4, 1865 –
March 3, 1867
39th Elected in 1864.
Retired.
1865–1885
Butte, Colusa, Del Norte, Humboldt, Lake, Lassen, Marin, Mendocino, Modoc, Napa, Plumas, Shasta, Sierra, Siskiyou, Solano, Sonoma, Sutter, Tehama, Trinity, Yolo, Yuba

James A. Johnson
(Downieville)
Democratic March 4, 1867 –
March 3, 1871
40th
41st
Elected in 1867.
Re-elected in 1868.
Retired.

John M. Coghlan
(Suisun City)
Republican March 4, 1871 –
March 3, 1873
42nd Elected in 1871.
Lost re-election.

John K. Luttrell
(Santa Rosa)
Democratic March 4, 1873 –
March 3, 1879
43rd
44th
45th
Elected in 1872.
Re-elected in 1875.
Re-elected in 1876.
Retired.

Campbell P. Berry
(Wheatville)
Democratic March 4, 1879 –
March 3, 1883
46th
47th
Elected in 1879.
Re-elected in 1880.
Retired.

Barclay Henley
(Santa Rosa)
Democratic March 4, 1883 –
March 3, 1885
48th Elected in 1882.
Redistricted to the 1st district.

Joseph McKenna
(Suisun City)
Republican March 4, 1885 –
March 28, 1892
49th
50th
51st
52nd
Elected in 1884.
Re-elected in 1886.
Re-elected in 1888.
Re-elected in 1890.
Resigned to become U.S. Circuit Judge.
1885–1895
Alameda, Contra Costa, Marin, Sacramento, Solano, Yolo
Vacant March 28, 1892 –
December 5, 1892
52nd

Samuel G. Hilborn
(Oakland)
Republican December 5, 1892 –
April 4, 1894
52nd
53rd
Lost election contest.

Warren B. English
(Oakland)
Democratic April 4, 1894 –
March 3, 1895
53rd Won election contest.
Lost re-election.
1895–1903
Alameda, Colusa, Contra Costa, Glenn, Lake, Solano, Yolo

Samuel G. Hilborn
(Oakland)
Republican March 4, 1895 –
March 3, 1899
54th
55th
Elected in 1894.
Re-elected in 1896.
Lost renomination.

Victor H. Metcalf
(Oakland)
Republican March 4, 1899 –
July 1, 1904
56th
57th
58th
Elected in 1898.
Re-elected in 1900.
Re-elected in 1902.
Resigned to become U.S. Secretary of Commerce and Labor.
1903–1913
Alameda, Contra Costa, Solano
Vacant July 1, 1904 –
November 8, 1904
58th

Joseph R. Knowland
(Alameda)
Republican November 8, 1904 –
March 3, 1913
58th
59th
60th
61st
62nd
Elected to finish Metcalf's term.
Elected in 1904.
Re-elected in 1906.
Re-elected in 1908.
Re-elected in 1910.
Redistricted to the 6th district.

Charles F. Curry
(Sacramento)
Republican March 4, 1913 –
October 10, 1930
63rd
64th
65th
66th
67th
68th
69th
70th
71st
Elected in 1912.
Re-elected in 1914.
Re-elected in 1916.
Re-elected in 1918.
Re-elected in 1920.
Re-elected in 1922.
Re-elected in 1924.
Re-elected in 1926.
Re-elected in 1928.
Died in office.
1913–1933
Contra Costa, Napa, Sacramento, San Joaquin, Solano, Yolo
Vacant October 11, 1930 –
March 3, 1931
71st

Charles F. Curry Jr.
(Sacramento)
Republican March 4, 1931 –
March 3, 1933
72nd Elected in 1930.
Lost re-election.

Frank H. Buck
(Vacaville)
Democratic March 4, 1933 –
September 17, 1942
73rd
74th
75th
76th
77th
Elected in 1932.
Re-elected in 1934.
Re-elected in 1936.
Re-elected in 1938.
Re-elected in 1940.
Died in office.
1933–1953
Napa, Sacramento, San Joaquin, Solano, Yolo
Vacant September 17, 1942 –
January 3, 1943
77th

J. Leroy Johnson
(Stockton)
Republican January 3, 1943 –
January 3, 1953
78th
79th
80th
81st
82nd
Elected in 1942.
Re-elected in 1944.
Re-elected in 1946.
Re-elected in 1948.
Re-elected in 1950.
Redistricted to the 11th district.

John E. Moss
(Sacramento)
Democratic January 3, 1953 –
December 31, 1978
83rd
84th
85th
86th
87th
88th
89th
90th
91st
92nd
93rd
94th
95th
Elected in 1952.
Re-elected in 1954.
Re-elected in 1956.
Re-elected in 1958.
Re-elected in 1960.
Re-elected in 1962.
Re-elected in 1964.
Re-elected in 1966.
Re-elected in 1968.
Re-elected in 1970.
Re-elected in 1972.
Re-elected in 1974.
Re-elected in 1976.
Retired; resigned before the term ended.
1953–1963
Colusa, Glenn, Sacramento, Sutter, Yolo, Yuba
1963–1967
Sacramento
1967–1975
Sacramento (Sacramento city)
1975–1983
Eastern two-thirds of Sacramento
Vacant December 31, 1978 –
January 3, 1979
95th

Bob Matsui
(Sacramento)
Democratic January 3, 1979 –
January 3, 1993
96th
97th
98th
99th
100th
101st
102nd
Elected in 1978.
Re-elected in 1980.
Re-elected in 1982.
Re-elected in 1984.
Re-elected in 1986.
Re-elected in 1988.
Re-elected in 1990.
Redistricted to the 5th district.
1983–1993
Sacramento (Sacramento city and eastern suburbs)

Vic Fazio
(West Sacramento)
Democratic January 3, 1993 –
January 3, 1999
103rd
104th
105th
Redistricted from the 4th district and re-elected in 1992.
Re-elected in 1994.
Re-elected in 1996.
Retired.
1993–2003
Southwestern Butte, Colusa, Glenn, northwestern Sacramento, eastern Solano, Sutter, Tehama, Yolo

Doug Ose
(Sacramento)
Republican January 3, 1999 –
January 3, 2005
106th
107th
108th
Elected in 1998.
Re-elected in 2000.
Re-elected in 2002.
Retired.
2003–2013

Alpine, Amador, Calaveras, most of suburban Sacramento, northern and eastern Solano

Dan Lungren
(Gold River)
Republican January 3, 2005 –
January 3, 2013
109th
110th
111th
112th
Elected in 2004.
Re-elected in 2006.
Re-elected in 2008.
Re-elected in 2010.
Redistricted to the 7th district and lost.

John Garamendi
(Walnut Grove)
Democratic January 3, 2013 –
January 3, 2023
113th
114th
115th
116th
117th
Redistricted from the 10th district and re-elected in 2012.
Re-elected in 2014.
Re-elected in 2016.
Re-elected in 2018.
Re-elected in 2020.
Redistricted to the 8th district.
2013–2023

North central California including Davis, Fairfield, and Yuba City

Kevin Kiley
(Rocklin)
Republican January 3, 2023 –
present
118th Elected in 2022.
Re-elected in 2024.
2023–present

Sierra Nevada region, including all of Alpine, Inyo, Mono, Nevada, Placer, Plumas, and Sierra and parts of El Dorado, Sacramento, and Yuba

Election results

[edit]

1864

[edit]
1864 United States House of Representatives elections in California, District 3
Party Candidate Votes %
Republican John Bidwell 18,255 56.1
Democratic Jack Temple 14,273 43.9
Total votes 32,528 100.0
Republican hold

1867

[edit]
1867 United States House of Representatives elections in California, District 3
Party Candidate Votes %
Democratic James A. Johnson 14,767 50.6
Republican Chancellor Hartson 14,394 49.4
Total votes 29,161 100.0
Democratic gain from Republican

1868

[edit]
1868 United States House of Representatives elections in California, District 3
Party Candidate Votes %
Democratic James A. Johnson (Incumbent) 15,792 50.4
Republican Chancellor Hartson 15,528 49.6
Total votes 31,320 100.0
Democratic hold

1871

[edit]
1871 United States House of Representatives elections in California, District 3
Party Candidate Votes %
Republican John M. Coghlan 18,503 51.7
Democratic George Pearce 17,309 48.3
Total votes 35,812 100.0
Republican gain from Democratic

1872

[edit]
1872 United States House of Representatives elections in California, District 3
Party Candidate Votes %
Democratic John K. Luttrell 14,032 51.7
Republican John M. Coghlan (Incumbent) 13,105 48.3
Total votes 27,137 100.0
Democratic gain from Republican

1875

[edit]
1875 United States House of Representatives elections in California, District 3
Party Candidate Votes %
Democratic John K. Luttrell (Incumbent) 18,468 55.1
Republican C. B. Denio 8,284 24.7
Independent Charles F. Reed 6,761 20.2
Total votes 33,513 100.0
Democratic hold

1876

[edit]
1876 United States House of Representatives elections in California, District 3
Party Candidate Votes %
Democratic John K. Luttrell (Incumbent) 19,846 51.1
Republican Joseph McKenna 18,990 48.9
Total votes 38,836 100.0
Democratic hold

1879

[edit]
1879 United States House of Representatives elections in California, District 3
Party Candidate Votes %
Democratic Campbell Polson Berry 20,019 50.2
Republican Joseph McKenna 19,800 49.6
Workingman's George T. Elliott 93 0.2
Total votes 39,912 100.0
Democratic hold

1880

[edit]
1880 United States House of Representatives elections in California, District 3
Party Candidate Votes %
Democratic Campbell Polson Berry (Incumbent) 21,743 51.1
Republican George A. Knight 20,494 48.2
Independent W. A. Howe 172 0.4
Greenback A. Musselman 85 0.2
Independent A. G. Clark 26 0.1
Total votes 42,520 100.0
Democratic hold

1882

[edit]
1882 United States House of Representatives elections in California, District 3
Party Candidate Votes %
Democratic Barclay Henley 21,807 51.3
Republican John J. De Haven 19,473 45.8
Prohibition H. S. Graves 862 2.0
Greenback W. Howe 401 0.9
Total votes 42,543 100.0
Democratic hold

1884

[edit]
1884 United States House of Representatives elections in California, District 3
Party Candidate Votes %
Republican Joseph McKenna 17,435 55.8
Democratic John R. Glascock (Incumbent) 13,197 42.3
Prohibition Joshua B. Wills 322 1.0
Populist A. B. Burns 273 0.9
Total votes 31,227 100.0
Republican win (new seat)

1886

[edit]
1886 United States House of Representatives elections in California, District 3
Party Candidate Votes %
Republican Joseph McKenna (Incumbent) 15,801 53.0
Democratic Henry C. McPike 13,277 44.5
Prohibition W. W. Smith 707 2.4
Independent W. J. Cuthbertson 32 0.1
Total votes 29,817 100.0
Republican hold

1888

[edit]
1888 United States House of Representatives elections in California, District 3
Party Candidate Votes %
Republican Joseph McKenna (Incumbent) 19,912 56.0
Democratic Ben Morgan 14,633 41.2
Prohibition W. W. Smith 657 1.9
Know Nothing S. Solon Hall 338 1.0
Total votes 35,540 100.0
Republican hold

1890

[edit]
1890 United States House of Representatives elections in California, District 3
Party Candidate Votes %
Republican Joseph McKenna (Incumbent) 20,834 55.4
Democratic John P. Irish 15,997 42.5
Prohibition O. O. Felkner 774 2.1
Total votes 37,605 100.0
Republican hold

1892 (Special)

[edit]
1892 United States House of Representatives elections in California, District 3
Party Candidate Votes %
Republican Samuel G. Hilborn 13,163 43.2
Democratic Warren B. English 13,138 43.1
Populist J. L. Lyon 3,495 11.5
Prohibition L. B. Scranton 671 2.2
Total votes 30,467 100.0
Republican hold

1894

[edit]
1894 United States House of Representatives elections in California, District 3
Party Candidate Votes %
Republican Samuel G. Hilborn 15,795 45.5
Democratic Warren B. English (Incumbent) 13,103 37.8
Populist W. A. Vann 5,162 14.9
Prohibition L. B. Scranton 637 1.8
Total votes 34,697 100.0
Republican gain from Democratic

1896

[edit]
1896 United States House of Representatives elections in California, District 3
Party Candidate Votes %
Republican Samuel Hilborn (Incumbent) 19,778 54.0
Democratic Warren B. English 16,119 44.0
Socialist John H. Eustice 387 1.1
Prohibition W. Shafer 327 0.9
Total votes 36,611 100.0
Republican hold

1898

[edit]
1898 United States House of Representatives elections in California, District 3
Party Candidate Votes %
Republican Victor H. Metcalf 20,592 57.3
Democratic John A. Jones 14,051 39.1
Socialist Labor Thomas F. Burns 1,309 3.6
Total votes 35,952 100.0
Republican hold

1900

[edit]
1900 United States House of Representatives elections in California, District 3
Party Candidate Votes %
Republican Victor H. Metcalf (Incumbent) 22,109 58.9
Democratic Frank Freeman 14,408 38.4
Socialist R. A. Dague 596 1.6
Prohibition Alvin W. Holt 431 1.1
Total votes 37,544 100.0
Republican hold

1902

[edit]
1902 United States House of Representatives elections in California, District 3
Party Candidate Votes %
Republican Victor H. Metcalf (Incumbent) 20,532 66.2
Democratic Calvin B. White 8,574 27.7
Socialist M. W. Wilkins 1,556 5.0
Prohibition T. H. Montgomery 338 1.1
Total votes 31,000 100.0
Republican hold

1904 (Special)

[edit]
1904 United States House of Representatives elections in California, District 3
Party Candidate Votes %
Republican Joseph R. Knowland (Incumbent) 24,637 68.6
Democratic Henry C. McPike 7,210 20.1
Socialist M. Lesser 3,617 10.1
Prohibition Bates Morris 471 1.3
Total votes 35,935 100.0
Republican hold

1906

[edit]
1906 United States House of Representatives elections in California, District 3
Party Candidate Votes %
Republican Joseph R. Knowland (Incumbent) 21,510 60.0
Democratic Hugh W. Brunk 7,716 21.5
Independence Charles C. Boynton 3,614 10.1
Socialist William McDevitt 2,514 7.0
Prohibition T. H. Montgomery 482 1.4
Total votes 35,836 100.0
Republican hold

1908

[edit]
1908 United States House of Representatives elections in California, District 3
Party Candidate Votes %
Republican Joseph R. Knowland (Incumbent) 27,857 64.1
Democratic George Peckham 9,889 22.8
Socialist O. W. Philbrick 4,052 9.3
Independence John A. Sands 923 2.1
Prohibition T. H. Montgomery 717 1.7
Total votes 43,438 100.0
Republican hold

1910

[edit]
1910 United States House of Representatives elections in California, District 3
Party Candidate Votes %
Republican Joseph R. Knowland (Incumbent) 34,291 81.9
Socialist S. Miller 6,653 15.9
Prohibition James N. Christian 906 2.2
Total votes 41,850 100.0
Republican hold

1912

[edit]
1912 United States House of Representatives elections in California, District 3
Party Candidate Votes %
Republican Charles F. Curry 31,060 58.8
Democratic Gilbert M. Ross 15,197 28.8
Socialist William L. Wilson 6,522 12.4
Total votes 52,779 100.0
Republican hold

1914

[edit]
1914 United States House of Representatives elections in California, District 3
Party Candidate Votes %
Republican Charles F. Curry (Incumbent) 66,034 85.0
Socialist David T. Ross 6,752 8.7
Prohibition Edwin F. Van Vlear 4,911 6.3
Total votes 77,697 100.0
Republican hold

1916

[edit]
1916 United States House of Representatives elections in California, District 3
Party Candidate Votes %
Republican Charles F. Curry (Incumbent) 48,193 66.7
Democratic O. W. Kennedy 16,900 23.4
Socialist Ben Cooper 4,455 6.2
Prohibition Edwin F. Van Vlear 2,694 3.7
Total votes 72,242 100.0
Republican hold

1918

[edit]
1918 United States House of Representatives elections in California, District 3
Party Candidate Votes %
Republican Charles F. Curry (Incumbent) 51,690 91.6
Socialist Allen K. Gifford 4,746 8.4
Total votes 56,436 100.0
Republican hold

1920

[edit]
United States House of Representatives elections[19]
Party Candidate Votes %
Republican Charles F. Curry (Incumbent) 54,984 74.7
Democratic J. W. Struckenbruck 14,964 20.4
Socialist Miles William Beck 3,631 4.9
Total votes 73,579 100.0
Republican hold

1922

[edit]
United States House of Representatives elections[20]
Party Candidate Votes %
Republican Charles F. Curry (Incumbent) 71,316 91.6
Socialist Marcus H. Steely 6,561 8.4
Total votes 77,877 100.0
Republican hold

1924

[edit]
United States House of Representatives elections[21]
Party Candidate Votes %
Republican Charles F. Curry (Incumbent) 61,512 80.7
Socialist James H. Barkley 14,665 19.3
Total votes 76,177 100.0
Republican hold

1926

[edit]
United States House of Representatives elections[22]
Party Candidate Votes %
Republican Charles F. Curry (Incumbent) 72,912 100.0
Republican hold

1928

[edit]
United States House of Representatives elections[23]
Party Candidate Votes %
Republican Charles F. Curry (Incumbent) 77,750 100.0
Republican hold

1930

[edit]
United States House of Representatives elections[24]
Party Candidate Votes %
Republican Charles F. Curry Jr. 43,336 53.4
Republican J. M. Inman 26,785 33.0
Democratic Frank H. Buck 9,172 11.3
Independent Katherine Braddock 1,753 2.2
Independent E. M. Turner 49 0.1
Total votes 80,095 100.0
Republican hold

1932

[edit]
United States House of Representatives elections[25]
Party Candidate Votes %
Democratic Frank H. Buck 61,694 56.8
Republican Charles F. Curry (Incumbent) 46,887 43.2
Total votes 108,581 100.0
Democratic gain from Republican

1934

[edit]
United States House of Representatives elections[26]
Party Candidate Votes %
Democratic Frank H. Buck (Incumbent) 66,566 53.3
Republican J. M. Inman 56,222 45.7
Communist Albert Hougardy 1,167 1.0
Total votes 122,955 100.0
Democratic hold

1936

[edit]
United States House of Representatives elections[27]
Party Candidate Votes %
Democratic Frank H. Buck (Incumbent) 93,110 90.6
Independent Walter Schaefer (write-in) 5,310 5.2
Communist Perry Hill 4,390 4.2
Total votes 98,810 100.0
Democratic hold

1938

[edit]
United States House of Representatives elections[28]
Party Candidate Votes %
Democratic Frank H. Buck (Incumbent) 119,236 93.3
Communist Nora Conklin 8,271 6.5
Independent Walter Schaefer (write-in) 327 0.2
Total votes 127,834 100.0
Democratic hold

1940

[edit]
United States House of Representatives elections[29]
Party Candidate Votes %
Democratic Frank H. Buck (Incumbent) 135,461 91.0
Prohibition C. H. Farman 10,539 7.1
Communist Charles Gricus 2,751 1.8
No party George Kimber (write-in) 122 0.1
Total votes 148,873 100.0
Democratic hold

1942

[edit]
United States House of Representatives elections[30]
Party Candidate Votes %
Republican Justin L. Johnson (Incumbent) 63,982 54.5
Democratic Joseph B. O'Neil 53,521 45.5
Total votes 117,503 100.0
Republican hold

1944

[edit]
United States House of Representatives elections[31]
Party Candidate Votes %
Republican Justin L. Johnson (Incumbent) 131,705 100.0
Republican hold

1946

[edit]
United States House of Representatives elections[32]
Party Candidate Votes %
Republican Justin L. Johnson (Incumbent) 116,792 100.0
Republican hold

1948

[edit]
United States House of Representatives elections[33]
Party Candidate Votes %
Republican Justin L. Johnson (Incumbent) 166,571 84.4
Progressive James B. "Bert" Willard 30,878 15.6
Total votes 197,449 100.0
Republican hold

1950

[edit]
United States House of Representatives elections[34]
Party Candidate Votes %
Republican Justin L. Johnson (Incumbent) 177,269 100.0
Republican hold

1952

[edit]
United States House of Representatives elections[35]
Party Candidate Votes %
Democratic John E. Moss 87,335 50.8
Republican Leslie E. Wood 82,133 47.8
Progressive Helen C. Thomsen 2,443 1.4
Total votes 171,911 100.0
Democratic hold

1954

[edit]
United States House of Representatives elections[36]
Party Candidate Votes %
Democratic John E. Moss (Incumbent) 96,238 65.3
Republican James H. Phillips 51,111 34.7
Total votes 147,349 100.0
Democratic hold

1956

[edit]
United States House of Representatives elections[37]
Party Candidate Votes %
Democratic John E. Moss (Incumbent) 132,930 68.6
Republican Noel C. Stevenson 60,889 31.4
Total votes 193,819 100.0
Democratic hold

1958

[edit]
United States House of Representatives elections[38]
Party Candidate Votes %
Democratic John E. Moss (Incumbent) 169,727 100.0
Democratic hold

1960

[edit]
1960 United States House of Representatives elections[39]
Party Candidate Votes %
Democratic John E. Moss (Incumbent) 200,439 100.0
Democratic hold

1962

[edit]
United States House of Representatives elections[40]
Party Candidate Votes %
Democratic John E. Moss (Incumbent) 138,257 74.8
Republican George W. G. Smith 46,510 25.2
Total votes 184,767 100.0
Democratic hold

1964

[edit]
United States House of Representatives elections[41]
Party Candidate Votes %
Democratic John E. Moss (Incumbent) 166,688 74.3
Republican Einer B. Gjelsteen 57,630 25.7
Total votes 224,318 100.0
Democratic hold

1966

[edit]
United States House of Representatives elections[42]
Party Candidate Votes %
Democratic John E. Moss (Incumbent) 143,177 67.5
Republican Terry G. Feil 69,057 32.5
Total votes 212,234 100.0
Democratic hold

1968

[edit]
United States House of Representatives elections[43]
Party Candidate Votes %
Democratic John E. Moss (Incumbent) 106,694 56.0
Republican Elmore J. Duffy 79,717 41.8
American Independent James Tarleton Slaughter 4,188 2.2
Total votes 190,599 100.0
Democratic hold

1970

[edit]
United States House of Representatives elections[44]
Party Candidate Votes %
Democratic John E. Moss (Incumbent) 117,496 61.6
Republican Elmore J. Duffy 69,811 36.6
American Independent Allen E. Priest 3,554 1.8
Total votes 190,861 100.0
Democratic hold

1972

[edit]
United States House of Representatives elections[45]
Party Candidate Votes %
Democratic John E. Moss (Incumbent) 151,035 69.9
Republican John Rakus 64,949 30.1
Total votes 215,984 100.0
Democratic hold

1974

[edit]
United States House of Representatives elections[46]
Party Candidate Votes %
Democratic John E. Moss (Incumbent) 121,842 72.3
Republican Ivaldo Lenci 46,585 27.7
Total votes 168,427 100.0
Democratic hold

1976

[edit]
United States House of Representatives elections[47]
Party Candidate Votes %
Democratic John E. Moss (Incumbent) 139,779 72.9
Republican George R. Marsh Jr. 52,075 27.1
Total votes 191,854 100.0
Democratic hold

1978

[edit]
United States House of Representatives elections[48]
Party Candidate Votes %
Democratic Bob Matsui 105,537 53.4
Republican Sandy Smoley 91,966 46.6
Total votes 197,503 100.0
Democratic hold

1980

[edit]
United States House of Representatives elections[49]
Party Candidate Votes %
Democratic Robert Matsui (Incumbent) 170,670 70.6
Republican Joseph Murphy 64,215 26.5
Libertarian Bruce A. Daniel 6,980 2.9
Total votes 241,865 100.0
Democratic hold

1982

[edit]
United States House of Representatives elections[50]
Party Candidate Votes %
Democratic Robert Matsui (Incumbent) 194,680 89.6
Libertarian Bruce A. Daniel 16,222 7.5
Peace and Freedom John Newmeyer 6,294 2.9
Total votes 217,196 100.0
Democratic hold

1984

[edit]
United States House of Representatives elections[51]
Party Candidate Votes %
Democratic Robert Matsui (Incumbent) 131,369 100.0
Democratic hold

1986

[edit]
United States House of Representatives elections[52]
Party Candidate Votes %
Democratic Robert Matsui (Incumbent) 158,709 75.9
Republican Lowell Patrick Landowski 50,265 24.1
Total votes 208,974 100.0
Democratic hold

1988

[edit]
United States House of Representatives elections[53]
Party Candidate Votes %
Democratic Robert Matsui (Incumbent) 183,470 71.2
Republican Lowell Patrick Landowski 74,296 28.8
Total votes 257,766 100.0
Democratic hold

1990

[edit]
United States House of Representatives elections[54]
Party Candidate Votes %
Democratic Robert Matsui (Incumbent) 132,143 60.3
Republican Lowell Patrick Landowski 76,148 34.8
Libertarian David M. McCann 10,797 4.9
Total votes 219,088 100.0
Democratic hold

1992

[edit]
United States House of Representatives elections[55]
Party Candidate Votes %
Democratic Vic Fazio (Incumbent) 112,149 51.2
Republican H. L. Richardson 96,092 40.3
Libertarian Ross Crain 20,444 8.6
Total votes 228,685 100.0
Democratic hold

1994

[edit]
United States House of Representatives elections[56]
Party Candidate Votes %
Democratic Vic Fazio (Incumbent) 97,093 49.75
Republican Tim Lefever 89,964 46.10
Libertarian Ross Crain 8,100 4.15
Total votes 195,157 100.0
Democratic hold

1996

[edit]
United States House of Representatives elections[57]
Party Candidate Votes %
Democratic Vic Fazio (Incumbent) 118,663 53.6
Republican Tim Lefever 91,134 41.1
Reform Timothy Erich 7,701 3.4
Libertarian Erin Donelle 4,239 1.9
Total votes 221,737 100.0
Democratic hold

1998

[edit]
United States House of Representatives elections[58]
Party Candidate Votes %
Republican Doug Ose 100,621 52.41
Democratic Sandie Dunn 86,471 45.04
Libertarian Ross Crain 4,914 2.56
Total votes 192,006 100.0
Republican gain from Democratic

2000

[edit]
United States House of Representatives elections[59]
Party Candidate Votes %
Republican Doug Ose (Incumbent) 129,254 56.2
Democratic Bob Kent 93,067 40.4
Libertarian Douglas Arthur Tuma 5,227 2.2
Natural Law Channing E. Jones 2,634 1.1
Total votes 230,182 100.0
Republican hold

2002

[edit]
United States House of Representatives elections[60]
Party Candidate Votes %
Republican Doug Ose (Incumbent) 117,466 62.4
Democratic Howard Beeman 64,990 34.5
Libertarian Douglas Arthur Tuma 5,847 3.1
Total votes 188,303 100.0
Republican hold

2004

[edit]
United States House of Representatives elections[61]
Party Candidate Votes %
Republican Dan Lungren 177,113 61.9
Democratic Gabe Castillo 99,750 34.9
Libertarian Douglas Tuma 9,274 3.2
Total votes 286,137 100.0
Republican hold

2006

[edit]
United States House of Representatives elections[62]
Party Candidate Votes %
Republican Dan Lungren (Incumbent) 135,709 59.5
Democratic William E. Durston 86,318 37.8
Libertarian Douglas A. Tuma 3,772 1.6
Peace and Freedom Michael L. Roskey 2,370 1.0
Total votes 228,169 100.0
Republican hold

2008

[edit]
United States House of Representatives elections[63]
Party Candidate Votes %
Republican Dan Lungren (Incumbent) 155,424 49.5
Democratic William E. Durston 137,971 44.0
Libertarian Douglas A. Tuma 7,273 2.3
Peace and Freedom Dina J. Padilla 13,378 4.2
Total votes 314,046 100.0
Republican hold

2010

[edit]
United States House of Representatives elections[64]
Party Candidate Votes %
Republican Dan Lungren (Incumbent) 131,169 50
Democratic Ami Bera 113,128 43
American Independent Jerry L. Leidecker 6,577 3%
Libertarian Douglas Arthur Tuma 6,275 2%
Peace and Freedom Mike Roskey 4,789 2%
Total votes 261,938 100
Republican hold

2012

[edit]
United States House of Representatives elections, 2012[65]
Party Candidate Votes %
Democratic John Garamendi (Incumbent) 126,882 54.2%
Republican Kim Vann 107,086 45.8%
Total votes 233,968 100.0%
Democratic hold

2014

[edit]
United States House of Representatives elections, 2014[66]
Party Candidate Votes %
Democratic John Garamendi (Incumbent) 79,224 52.7%
Republican Dan Logue 71,036 47.3%
Total votes 150,260 100.0%
Democratic hold

2016

[edit]
United States House of Representatives elections, 2016[67]
Party Candidate Votes %
Democratic John Garamendi (Incumbent) 152,513 59.4%
Republican Eugene Cleek 104,453 40.6%
Total votes 256,966 100.0%
Democratic hold

2018

[edit]
2018 United States House of Representatives elections in California, District 3
Party Candidate Votes %
Democratic John Garamendi (Incumbent) 134,875 58.1
Republican Charlie Schaupp 97,376 41.9
Total votes 232,251 100.0
Democratic hold

2020

[edit]
2020 United States House of Representatives elections in California, District 3
Party Candidate Votes %
Democratic John Garamendi (incumbent) 176,036 54.7
Republican Tamika Hamilton 145,941 45.3
Total votes 321,977 100.0
Democratic hold

2022

[edit]
2022 United States House of Representatives elections in California, District 3
Party Candidate Votes %
Republican Kevin Kiley 181,438 53.6
Democratic Kermit Jones 156,761 46.4
Total votes 338,199 100.0
Republican win (new seat)

Historical district boundaries

[edit]
2003 - 2013
2013 - 2023

See also

[edit]

References

[edit]
  1. ^ a b "CA 2022 Congressional". Dave's Redistricting. January 4, 2022. Retrieved November 11, 2022.
  2. ^ "My Congressional District: Congressional District 3 (118th Congress), California". United States Census Bureau.
  3. ^ "2022 Cook PVI: District Map and List". Cook Political Report. Retrieved January 10, 2023.
  4. ^ "Maps: Final Congressional Districts". Citizens Redistricting Commission. Archived from the original on March 10, 2013. Retrieved February 24, 2013.
  5. ^ "Counties by Congressional District for Recall Question" (PDF). sos.ca.gov. September 14, 2021. Retrieved May 2, 2022.
  6. ^ "Counties by Congressional Districts for Governor" (PDF). sos.ca.gov. November 8, 2022. Retrieved May 4, 2023.
  7. ^ "Statement of Vote (2000 President)" (PDF). Archived from the original (PDF) on May 20, 2011. Retrieved September 17, 2008.
  8. ^ "Statement of Vote (2000 Senator)" (PDF). Archived from the original (PDF) on May 20, 2011. Retrieved September 17, 2008.
  9. ^ "Statement of Vote (2002 Governor)" (PDF). Archived from the original (PDF) on November 11, 2010. Retrieved April 5, 2023.
  10. ^ "Statement of Vote (2003 Recall Question)" (PDF). Archived from the original (PDF) on May 20, 2011. Retrieved October 8, 2007.
  11. ^ "Statement of Vote (2003 Governor)" (PDF). Archived from the original (PDF) on May 20, 2011. Retrieved October 8, 2007.
  12. ^ "Statement of Vote (2004 President)" (PDF). Archived from the original (PDF) on May 20, 2011. Retrieved August 8, 2007.
  13. ^ "Statement of Vote (2004 Senator)" (PDF). Archived from the original (PDF) on August 10, 2011. Retrieved April 5, 2023.
  14. ^ "Statement of Vote (2006 Governor)" (PDF). Archived from the original (PDF) on August 10, 2011. Retrieved April 5, 2023.
  15. ^ "Statement of Vote (2006 Senator)" (PDF). Archived from the original (PDF) on August 10, 2011. Retrieved April 5, 2023.
  16. ^ "(2008 President)". Archived from the original on June 26, 2009. Retrieved March 5, 2009.
  17. ^ "Statement of Vote (2010 Governor)" (PDF). Archived from the original (PDF) on May 20, 2011. Retrieved May 6, 2011.
  18. ^ "Statement of Vote (2010 Governor" (PDF). Archived from the original (PDF) on May 20, 2011. Retrieved May 6, 2011.
  19. ^ 1920 general election results
  20. ^ "1922 general election results" (PDF). Retrieved April 5, 2023.
  21. ^ 1924 general election results
  22. ^ 1926 general election results
  23. ^ 1928 general election results
  24. ^ 1930 general election results
  25. ^ 1932 general election results
  26. ^ 1934 general election results
  27. ^ 1936 general election results
  28. ^ 1938 general election results
  29. ^ 1940 general election results
  30. ^ 1942 general election results
  31. ^ 1944 general election results
  32. ^ 1946 general election results
  33. ^ 1948 general election results
  34. ^ 1950 general election results
  35. ^ 1952 general election results
  36. ^ 1954 general election results
  37. ^ 1956 general election results
  38. ^ 1958 general election results
  39. ^ 1960 general election results
  40. ^ 1962 general election results
  41. ^ 1964 general election results
  42. ^ 1966 general election results
  43. ^ 1968 general election results
  44. ^ 1970 general election results
  45. ^ 1972 general election results
  46. ^ 1974 general election results
  47. ^ 1976 general election results
  48. ^ 1978 general election results
  49. ^ 1980 general election results
  50. ^ 1982 general election results
  51. ^ 1984 general election results
  52. ^ 1986 general election results
  53. ^ 1988 general election results
  54. ^ 1990 general election results
  55. ^ 1992 general election results
  56. ^ 1994 general election results
  57. ^ 1996 general election results
  58. ^ 1998 general election results
  59. ^ 2000 general election results
  60. ^ 2002 general election results Archived February 3, 2009, at the Wayback Machine
  61. ^ 2004 general election results Archived August 21, 2008, at the Wayback Machine
  62. ^ 2006 general election results Archived November 27, 2008, at the Wayback Machine
  63. ^ 2008 general election results Archived December 21, 2008, at the Wayback Machine
  64. ^ 2010 general election results[permanent dead link]
  65. ^ https://elections.cdn.sos.ca.gov/sov/2012-general/06-sov-summary.xls
  66. ^ https://elections.cdn.sos.ca.gov/sov/2014-general/xls/06-summary.xls
  67. ^ https://elections.cdn.sos.ca.gov/sov/2016-general/sov/csv-candidates.xls
[edit]

38°54′N 122°00′W / 38.9°N 122.0°W / 38.9; -122.0