Image tracing
This article has multiple issues. Please help improve it or discuss these issues on the talk page. (Learn how and when to remove these messages)
|
In computer graphics, image tracing, raster-to-vector conversion or raster vectorization is the conversion of raster graphics into vector graphics.
Background
[edit]
An image does not have any structure: it is just a collection of marks on paper, grains in film, or pixels in a bitmap. While such an image is useful, it has some limits. If the image is magnified enough, its artifacts appear. The halftone dots, film grains, and pixels become apparent. Images of sharp edges become fuzzy or jagged. See, for example, pixelation. Ideally, a vector image does not have the same problem. Edges and filled areas are represented as mathematical curves or gradients, and they can be magnified arbitrarily (though of course the final image must also be rasterized in to be rendered, and its quality depends on the quality of the rasterization algorithm for the given inputs).
The task in vectorization is to convert a two-dimensional image into a two-dimensional vector representation of the image. It is not examining the image and attempting to recognize or extract a three-dimensional model that may be depicted; i.e. it is not a vision system. For most applications, vectorization also does not involve optical character recognition; characters are treated as lines, curves, or filled objects without attaching any significance to them. In vectorization, the shape of the character is preserved, so artistic embellishments remain.
Vectorization is the inverse operation corresponding to rasterization, as integration is to differentiation. And, just as with these other two operations, while rasterization is fairly straightforward and algorithmic, vectorization involves the reconstruction of lost information and therefore requires heuristic methods.
Synthetic images such as maps, cartoons, logos, clip art, and technical drawings are suitable for vectorization. Those images could have been originally made as vector images because they are based on geometric shapes or drawn with simple curves.
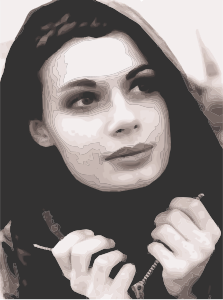
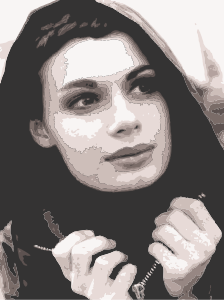
Continuous tone photographs (such as live portraits) are not good candidates for vectorization.
The input to vectorization is an image, but an image may come in many forms such as a photograph, a drawing on paper, or one of several raster file formats. Programs that do raster-to-vector conversion may accept bitmap formats such as TIFF, BMP and PNG.
The output is a vector file format. Common vector formats are SVG, DXF, EPS, EMF and AI.
Vectorization can be used to update images or recover work. Personal computers often come with a simple paint program that produces a bitmap output file. These programs allow users to make simple illustrations by adding text, drawing outlines, and filling outlines with a specific color. Only the results of these operations (the pixels) are saved in the resulting bitmap; the drawing and filling operations are discarded. Vectorization can be used to recapture some of the information that was lost.
Vectorization is also used to recover information that was originally in a vector format but has been lost or has become unavailable. A company may have commissioned a logo from a graphic arts firm. Although the graphics firm used a vector format, the client company may not have received a copy of that format. The company may then acquire a vector format by scanning and vectorizing a paper copy of the logo.
Process
[edit]

Vectorization starts with an image.
Manual
[edit]The image can be vectorized manually. A person could look at the image, make some measurements, and then write the output file by hand. That was the case for the vectorization of a technical illustration about neutrinos. The illustration has a few geometric shapes and a lot of text; it was relatively easy to convert the shapes, and the SVG vector format allows the text (even subscripts and superscripts) to be entered easily.
The original image did not have any curves (except for the text), so the conversion is straightforward. Curves make the conversion more complicated. Manual vectorization of complicated shapes can be facilitated by the tracing function built into some vector graphics editing programs.
If the image is not yet in machine readable form, then it has to be scanned into a usable file format.
Once there is a machine-readable bitmap, the image can be imported into a graphics editing program (such as Adobe Illustrator, CorelDRAW, or Inkscape). Then a person can manually trace the elements of the image using the program's editing features. Curves in the original image can be approximated with lines, arcs, and Bézier curves. An illustration program allows spline knots to be adjusted for a close fit. Manual vectorization is possible, but it can be tedious.
Although graphics drawing programs have been around for a long time, artists may find the freehand drawing facilities awkward even when a drawing tablet is used. Instead of using a program, Pepper recommends making an initial sketch on paper. Instead of scanning the sketch and tracing it freehand in the computer, Pepper states: "Those proficient with a graphic tablet and stylus could make the following changes directly in CorelDRAW by using a scan of the sketch as an underlay and drawing over it. I prefer to use pen and ink, and a light table"; most of the final image was traced by hand in ink. Later the line-drawing image was scanned at 600 dpi, cleaned up in a paint program, and then automatically traced with a program.[1] Once the black and white image was in the graphics program, some other elements were added and the figure was colored.
Similarly, Ploch recreated a design from a digital photograph. The JPEG was imported and some "basic shapes" were traced by hand and colored in the graphics drawing program; more complex shapes were handled differently. Ploch used a bitmap editor to remove the background and crop the more complex image components. He then printed the image and traced it by hand onto tracing paper to get a clean black and white line drawing. That drawing was scanned and then vectorized with a program.[2]
Automatic
[edit]Some programs automate the vectorization process. Example programs are Adobe Streamline (discontinued), Corel's PowerTRACE, and Potrace. Some of these programs have a command line interface while others are interactive that allow the user to adjust the conversion settings and view the result. Adobe Streamline is not only an interactive program, but it also allows a user to manually edit the input bitmap and the output curves. Corel's PowerTRACE is accessed through CorelDRAW; CorelDRAW can be used to modify the input bitmap and edit the output curves. Adobe Illustrator has a facility to trace individual curves.[3]
Automated programs can have mixed results. A program (PowerTRACE) was used to convert a PNG map to SVG. The program did a good job on the map boundaries (the most tedious task in the tracing) and the settings dropped out all the text (small objects). The text was manually re-inserted.

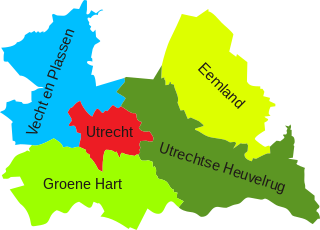
Other conversions may not go as well. The results depend on having high-quality scans, reasonable settings, and good algorithms.
Scanned images often have a lot of noise. The bitmap image may need a lot of work to clean it up. Erase stray marks and fill in lines and areas.
Corel advice: Put the image on a light table, cover it with vellum (tracing paper), and then manually ink the desired outlines. Then scan the vellum and use an automated raster-to-vector conversion program on that scan.
Options
[edit]
There are many different image styles and possibilities, and no single vectorization method works well on all images. Consequently, vectorization programs have many options that influence the result.
One issue is what the predominant shapes are. If the image is of a fill-in form, then it will probably have just vertical and horizontal lines of a constant width. The program's vectorization should take that into account. On the other hand, a CAD drawing may have lines at any angle, there may be curved lines, and there may be several line weights (thick for objects and thin for dimension lines). Instead of (or in addition to) curves, the image may contain outlines filled with the same color. Adobe Streamline allows users to select a combination of line recognition (horizontal and vertical lines), centerline recognition, or outline recognition.[4] Streamline also allows small outline shapes to be thrown out; the notion is such small shapes are noise.[5] The user may set the noise level between 0 and 1000; an outline that has fewer pixels than that setting is discarded.
Another issue is the number of colors in the image. Even images that were created as black on white drawings may end up with many shades of gray. Some line-drawing routines employ anti-aliasing; a pixel completely covered by the line will be black, but a pixel that is only partially covered will be gray. If the original image is on paper and is scanned, there is a similar result: edge pixels will be gray. Sometimes images are compressed (e.g., JPEG images), and the compression will introduce gray levels.
Many of the vectorization programs will group same-color pixels into lines, curves, or outlined shapes. If each possible color is grouped into its object, there can be an enormous number of objects. Instead, the user is asked to select a finite number of colors (usually less than 256), the image is reduced to using that many colors (this step is color quantization), and then the vectorization is done on the reduced image.[6] For continuous tone images such as photographs, the result of color quantization is posterization. Gradient fills will also be posterized.[7]
Reducing the number of colors in an image is often aided by a histogram. The most common colors may be selected as the representatives, and other colors are mapped to their closest representative. When the number of colors is set to two, the user may be asked to make threshold and contrast settings.[8] A contrast setting looks for significant changes in pixel color rather than a particular color; consequently, it may ignore the gradual color variations in a gradient fill. Once the outline has been extracted, the user can manually reintroduce the gradient fill.
The vectorization program will want to group a region of the same color into a single object. It can do that by making the region boundary exactly follow the pixel boundaries, but the result will be a boundary of often short orthogonal lines. The resulting conversion will also have the same pixelation problems that a bitmap has when it is magnified. Instead, the vectorization program needs to approximate the region boundary with lines and curves that closely follow the pixel boundaries but are not exactly the pixel boundaries. A tolerance parameter tells the program how closely it should follow the pixel boundaries.[9]
The end result of many vectorization programs are curves consisting of cubic Bézier curves. A region boundary is approximated with several curve segments. To keep a curve smooth, the joints of two curves are constrained so the tangents match. One problem is determining where a curve bends so sharply that it should not be smooth.[10] The smooth portions of a curve are then approximated with a Bézier curve fitting procedure. Successive division may be used. Such a fitting procedure tries to fit the curve with a single cubic curve; if the fit is acceptable, then the procedure stops. Otherwise, it selects some advantageous point along the curve and breaks the curve into two parts. It then fits the parts while keeping the joint tangent. If the fit is still unacceptable, then it breaks the curve into more parts.[11]
Some vectorizers are standalone programs, but many have interactive interfaces that allow a user to adjust the program parameters and quickly see the result. PowerTRACE, for example, can display the original image and preview the converted image so the user may compare them; the program also reports information such as the number of curves.[12]
Example
[edit]-
Original artwork in PNG format; 115 kB.
-
Traced with PowerTRACE using detailed logo, smoothing 40, detail +2.5; result: 50 colors, 94 curves, 2452 nodes, 96 kB.
On the right is an illustration showing the operation of the radula in mollusks. The upper portion is mostly a one-pen-width filled outline diagram, but it has a mesh gradient fill along the bottom of the shell and along the bottom of the food. It also has some artistic brushes on the upper left of the shell. The bottom portion of the illustration has four line weights and some small characters; the color fill is simple except for a gradient at the jagged lines.
The 531×879 pixel image was traced; 50 colors were used. Most (if not all) lines were lost; they were turned into black regions, and their effective line widths varied. The black outline around the blue food in the upper part disappeared. The gradient fills and brushed spots were lost to color quantization/posterization; some brush spots disappeared. Some letters survived the vectorization with distortion, but most letters were discarded. Losing the letters is not a big issue; post conversion editing would want to delete the annotation and replace it with text rather than curves. Thin lines crossing at a shallow angle made filled regions, and intersecting outlines of filled regions became confused; see lower right corner. The tracing also has some odd features. Many black outlines touch, so they become large, complicated, objects rather than just outlines for specific regions. Instead of just a background, a rectangular white region separates the two outlined rectangles. The objects labeled op, rp, and rr are not simple layered shapes; the desired result would have rr overlaid by rp which is overlaid by op.
Usage domains
[edit]- In computer-aided design (CAD) drawings (blueprints etc.) are scanned, vectorized, and written as CAD files in a process called paper-to-CAD conversion or drawing conversion.
- In geographic information systems (GIS) satellite or aerial images are vectorized to create maps.
- In graphic design and photography, graphics can be vectorized for easier usage and resizing.
- Vectorization is often the first step in OCR solutions for handwritten text or signatures.
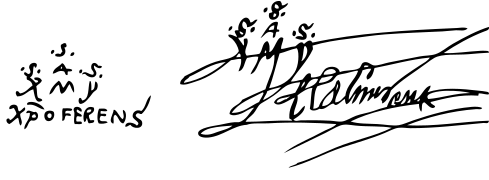
Vectorization is effective on single colored, nongradient input data, like signatures.
-
Vectorized two-color (black & white) variant of the signature of Christopher Columbus, 19 kB
Continuous tone images
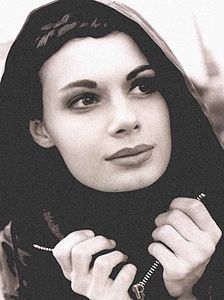
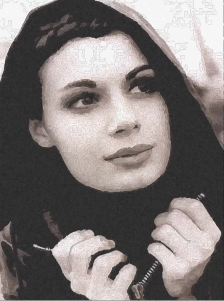
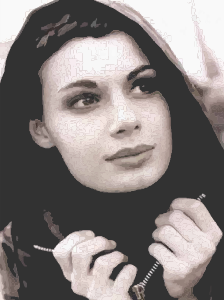
[edit]Vectorization is usually inappropriate for continuous tone images such as portraits. The result is often poor. For example, many different image tracing algorithms were applied to a 25 kB JPEG image. The resulting vector images are at least a factor of ten larger and may have pronounced posterization effects when a small number of colors are used.
-
A photograph in JPEG format, 25 KB
-
The photograph at left vectorized with RaveGrid, 1.64 MB
-
Same photograph vectorized with AutoTrace in the Delineate GUI, 677 KB
-
Same photograph vectorized with Scan2CAD, 340 KB
-
Vectormagic, 12 colors, 369 KB
-
Vectormagic, all colors, 744 KB
-
Super Vectorizer, 12 colors, 225 KB
See also
[edit]- Rasterization
- CAD data exchange
- Comparison of raster-to-vector conversion software
- Digitizing
- Discretization error
- Downsampling
- Feature detection (computer vision)
- Edge detection
- Image scanner
- Optical character recognition
- Quantization error
- Subpaving
References
[edit]- ^ Pepper 2005, pp. 68–71
- ^ Ploch 2005, p. 17
- ^ Adobe 1998, pp. 100–101
- ^ Adobe 1992, p. 39
- ^ Adobe 1992, pp. 40–41
- ^ Adobe 1992, p. 53
- ^ Adobe (1998, pp. 348–350) discusses color banding in gradient fills.
- ^ Adobe 1992, pp. 54–55
- ^ Adobe 1992, pp. 59–60
- ^ Itoh & Ohno 1993
- ^ Schneider 1990
- ^ Corel 2005, p. 217
- Adobe (1992), Adobe Streamline User Guide (version 3 for Windows ed.), Mountain View, CA: Adobe Systems
- Adobe (August 1998), Adobe Illustrator User Guide (version 8.0 ed.), Mountain View, CA: Adobe Systems, 90012366
- Corel (2005), User Guide, CorelDRAW X3 Graphics Suite, Ottawa, ON: Corel Corporation, pp. 213–220
- Pepper, K. N. (2005), "Cartooning with CorelDRAW", in Corel (ed.), CorelDRAW Handbook: Insights from the Experts, CorelDRAW X3 Graphics Suite, Corel Corporation, pp. 64–77
- Ploch, Michael (2005), "Re-creating vintage designs on t-shirts", in Corel (ed.), CorelDRAW Handbook: Insights from the Experts, CorelDRAW X3 Graphics Suite, Corel Corporation, pp. 12–23
- Schneider, Philip J. (1990), "An Algorithm for Automatically Fitting Digitized Curves", in Glassner, Andrew S. (ed.), Graphics Gems, Boston, MA: Academic Press, pp. 612–626, ISBN 0-12-059756-X
Further reading
[edit]- Avrahami, Gideon; Pratt, Vaughan (29 November 1991), "Sub-pixel Edge Detection in Character Digitization", in Morris, R.; André, J. (eds.), Raster Imaging and Digital Typography II, Cambridge University Press, pp. 54–64, ISBN 9780521417648
- Itoh, Koichi; Ohno, Yoshio (September 1993), "A curve fitting algorithm for character fonts", Electronic Publishing, 6 (3), John Wiley: 195–205, CiteSeerX 10.1.1.39.537


