
Bassetlaw District Council elections
(Redirected from Bassetlaw local elections)
Bassetlaw District Council elections are held every four years. Prior to 2015, elections were generally held three years out of every four, with a third of the council being elected each time. Bassetlaw District Council is the local authority for the non-metropolitan district of Bassetlaw in Nottinghamshire, England. Since the last boundary changes in 2002, 48 councillors have been elected from 25 wards.[1]
Council elections
[edit]| Year | Party in control | Turnout | SEATS | VOTE % | Notes | |||||||||
|---|---|---|---|---|---|---|---|---|---|---|---|---|---|---|
| Lab | Con | LD | Ind | Oth | Lab | Con | LD | Ind | Oth | |||||
| 1973 | Labour | 48.1% | 29 | 11 | 0 | 11 | 43.9% | 24.4% | 0.0% | 27.8% | 3.8% | |||
| 1976 | No overall control | 47.3% | 18 | 24 | 0 | 9 | 31.9% | 37.8% | 5.9% | 17.6% | 6.8% | |||
| 1979 | Labour | 76.9% | 29 | 17 | 0 | 4 | 46.6% | 37.3% | 5.5% | 8.5% | 2.1% | New ward boundaries | ||
| 1980 | Labour | 43.2% | 31 | 15 | 0 | 4 | 53.7% | 30.6% | 4.7% | 9.4% | 1.7% | |||
| 1982 | Labour | 40.5% | 28 | 14 | 1 | 7 | 37.1% | 34.9% | 23.9% | 4.0% | 0.0% | |||
| 1983 | Labour | 45.4% | 27 | 19 | 1 | 3 | 46.0% | 37.5% | 13.6% | 2.9% | 0.0% | |||
| 1984 | Labour | 46.3% | 26 | 17 | 0 | 7 | 52.3% | 36.6% | 9.8% | 0.9% | 0.4% | |||
| 1986 | Labour | 43.8% | 27 | 19 | 0 | 4 | 49.2% | 33.3% | 11.8% | 2.2% | 3.5% | |||
| 1987 | Labour | 48.1% | 27 | 18 | 0 | 1 | 45.8% | 33.2% | 14.4% | 3.7% | 2.9% | |||
| 1988 | Labour | 42.1% | 26 | 19 | 0 | 5 | 55.8% | 35.9% | 4.4% | 0.6% | 3.4% | |||
| 1990 | Labour | 50.2% | 29 | 15 | 1 | 5 | 61.6% | 27.3% | 6.8% | 3.4% | 0.9% | |||
| 1991 | Labour | 42.2% | 29 | 15 | 1 | 5 | 51.4% | 27.6% | 7.7% | 11.7% | 1.6% | |||
| 1992 | Labour | 36.6% | 30 | 17 | 1 | 2 | 44.9% | 43.3% | 6.6% | 5.2% | 0.0% | |||
| 1994 | Labour | 39.6% | 30 | 16 | 2 | 2 | 59.1% | 23.5% | 9.9% | 7.6% | 0.0% | |||
| 1995 | Labour | 35.2% | 33 | 12 | 2 | 3 | 62.1% | 25.1% | 6.4% | 3.4% | 3.0% | |||
| 1996 | Labour | 29.9% | 34 | 6 | 3 | 5 | 59.1% | 22.5% | 5.9% | 12.4% | 0.0% | |||
| 1998 | Labour | 25.7% | 35 | 8 | 3 | 4 | 54.1% | 35.4% | 8.6% | 0.0% | 2.0% | |||
| 1999 | Labour | 26.3% | 32 | 12 | 3 | 3 | 50.3% | 34.9% | 8.4% | 3.6% | 2.8% | |||
| 2000 | Labour | 25.8% | 31 | 14 | 3 | 2 | 44.6% | 41.8% | 10.1% | 2.5% | 1.0% | |||
| 2002 | Labour | 29.7% | 28 | 16 | 3 | 1 | 41.1% | 40.0% | 8.3% | 7.6% | 3.0% | New ward boundaries | ||
| 2003 | Labour | 27.3% | 25 | 19 | 2 | 2 | 38.3% | 40.1% | 6.9% | 11.8% | 2.9% | |||
| 2004 | No overall control | 42.1% | 18 | 24 | 1 | 5 | 42.2% | 40.9% | 4.5% | 12.4% | - | |||
| 2006 | Conservative | 40.4% | 14 | 28 | 1 | 5 | 46.3% | 46.4% | - | 6.5% | 0.8% | |||
| 2007 | Conservative | 32.1% | 16 | 27 | 0 | 5 | 45.9% | 46.8% | 0.7% | 6.6% | - | |||
| 2008 | Conservative | 32.3% | 16 | 30 | 0 | 2 | 39.9% | 47.9% | - | 11.1% | 1.2% | |||
| 2010 | Conservative | 62.1% | 25 | 20 | 0 | 3 | 55.4% | 36.5% | 2.1% | 5.3% | 0.7% | |||
| 2011 | Labour | 42.0% | 27 | 18 | 0 | 3 | 62.7% | 34.0% | 1.2% | 2.1% | - | |||
| 2012 | Labour | 32.2% | 34 | 11 | 0 | 3 | 65.8% | 29.1% | 1.3% | 3.7% | - | |||
| 2014 | Labour | 32.6% | 35 | 10 | 0 | 3 | 49.8% | 19.5% | 1.5% | 2.9% | 26.3% | |||
| 2015 | Labour | 63.7% | 33 | 12 | 0 | 3 | 0 | 41.1% | 33.8% | 1.4% | 4.0% | 19.7% | ||
| 2019 | Labour | 30.0% | 37 | 5 | 1 | 5 | 0 | 45.4% | 29.0% | 4.7% | 13.0% | 8.0% | ||
| 2023 | Labour | 31.5% | 38 | 8 | 0 | 2 | 0 | 47.1% | 35.5% | 4.0% | 9.5% | 3.9% | ||
District result maps
[edit]-
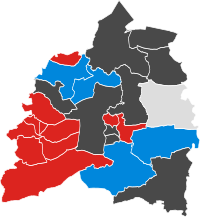
 2010 results map
 -
 2011 results map
 -
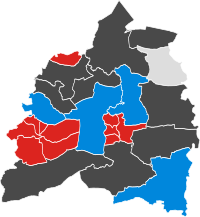 2012 results map
 -
 2014 results map
 -
 2015 results map
 -
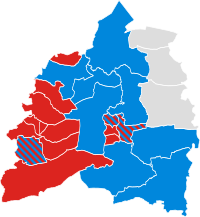
 2019 results map
 -
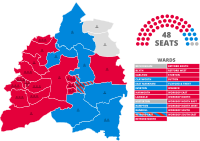 2023 results map


By-elections
[edit]1995-1999
[edit]| Party | Candidate | Votes | % | ±% | |
|---|---|---|---|---|---|
| Conservative | Mike Quigley | 788 | 54.6 | +5.1 | |
| Labour | Susan Shaw | 492 | 34.1 | −5.3 | |
| Liberal Democrats | Elizabeth Dobbie | 163 | 11.3 | +0.2 | |
| Majority | 296 | 20.5 | |||
| Turnout | 1,443 | 24.8 | |||
| Conservative gain from Labour | Swing | ||||
2003-2007
[edit]| Party | Candidate | Votes | % | ±% | |
|---|---|---|---|---|---|
| Conservative | 335 | 87.5 | +58.0 | ||
| Labour | 48 | 12.5 | +12.5 | ||
| Majority | 287 | 75.0 | |||
| Turnout | 383 | 24.0 | |||
| Conservative gain from Liberal Democrats | Swing | ||||
2007-2011
[edit]| Party | Candidate | Votes | % | ±% | |
|---|---|---|---|---|---|
| Labour | Sylvia May | 815 | 51.98 | +4.22 | |
| Conservative | Alec Thorpe | 669 | 42.67 | −10.59 | |
| Liberal Democrats | Leon Maurice Duveen | 84 | 5.36 | +5.36 | |
| Turnout | 1,568 | 28.5 | |||
| Party | Candidate | Votes | % | ±% | |
|---|---|---|---|---|---|
| Labour | Gloria June Evans | 1,345 | 82.31 | ||
| Conservative | Tracey Lee Taylor | 182 | 11.14 | ||
| Independent | Richard Vernon Bennett | 68 | 4.16 | ||
| Liberal Democrats | Mark Peter Hunter | 39 | 2.39 | ||
| Turnout | 1,634 | 27.53 | |||
| Party | Candidate | Votes | % | ±% | |
|---|---|---|---|---|---|
| Labour | John William Henry Anderton | 1,198 | 74.04 | ||
| Conservative | Barry Albert Bowles | 317 | 19.59 | ||
| Independent | Geoffrey Ernest Coe | 75 | 4.64 | ||
| Liberal Democrats | Mark Peter Hunter | 28 | 1.73 | ||
| Turnout | 1,618 | 32.09 | |||
2015-2019
[edit]| Party | Candidate | Votes | % | ±% | |
|---|---|---|---|---|---|
| Labour | Clayton Tindle | 1,004 | 77.3 | +21.1 | |
| Conservative | Lewis Antony Stanniland | 197 | 15.2 | +15.2 | |
| Liberal Democrats | Leon Maurice Duveen | 98 | 7.5 | +7.5 | |
| Turnout | 23.28 | ||||
| Conservative hold | Swing | ||||
| Party | Candidate | Votes | % | ±% | |
|---|---|---|---|---|---|
| Labour | Matthew Callingham | 441 | 49.9 | +12.6 | |
| Conservative | Emma Auckland | 296 | 33.5 | +4.8 | |
| Liberal Democrats | Helen Tamblyn-Saville | 146 | 16.5 | +3.7 | |
| Majority | 145 | 16.4 | |||
| Turnout | 883 | ||||
| Labour hold | Swing | ||||
2019-2023
[edit]| Party | Candidate | Votes | % | ±% | |
|---|---|---|---|---|---|
| Conservative | Gerald Bowers | 454 | 63.0 | +34.0 | |
| Independent | Michael Gray | 193 | 26.8 | +1.7 | |
| Liberal Democrats | Leon Duveen | 74 | 10.3 | +3.9 | |
| Majority | 261 | 36.2 | |||
| Turnout | 721 | ||||
| Conservative gain from Labour | Swing | ||||
| Party | Candidate | Votes | % | ±% | |
|---|---|---|---|---|---|
| Conservative | Denise Depledge | 422 | 63.7 | +37.3 | |
| Labour | Laura Sanders | 134 | 20.2 | +8.2 | |
| Liberal Democrats | Richard Harris | 107 | 16.1 | +16.1 | |
| Majority | 288 | 43.4 | |||
| Turnout | 663 | ||||
| Conservative gain from Independent | Swing | ||||
| Party | Candidate | Votes | % | ±% | |
|---|---|---|---|---|---|
| Conservative | Lewis Stanniland | 745 | 57.7 | +14.2 | |
| Labour | David Naylor | 472 | 36.5 | +16.9 | |
| Liberal Democrats | James Nixon | 75 | 5.8 | +5.8 | |
| Majority | 273 | 21.1 | |||
| Turnout | 1,292 | ||||
| Conservative hold | Swing | ||||
| Party | Candidate | Votes | % | ±% | |
|---|---|---|---|---|---|
| Conservative | Mike Introna | 493 | 40.1 | +22.5 | |
| Independent | Helen Richards | 488 | 39.7 | +39.7 | |
| Labour | James Napier | 247 | 20.1 | −42.0 | |
| Majority | 5 | 0.4 | |||
| Turnout | 1,288 | ||||
| Conservative gain from Labour | Swing | ||||
| Party | Candidate | Votes | % | ±% | |
|---|---|---|---|---|---|
| Labour | Darrell Pulk | 301 | 55.9 | +35.7 | |
| Conservative | Fraser McFarland | 224 | 41.6 | −22.1 | |
| Liberal Democrats | Phil Ray | 13 | 2.4 | −13.7 | |
| Majority | 77 | 14.3 | |||
| Turnout | 538 | ||||
| Labour gain from Conservative | Swing | ||||
2023-2027
[edit]| Party | Candidate | Votes | % | ±% | |
|---|---|---|---|---|---|
| Conservative | Simon Richardson | 652 | 59.2 | −11.4 | |
| Labour | Ray Fielding | 278 | 25.2 | −4.2 | |
| Liberal Democrats | Simon Russell | 172 | 15.6 | +15.6 | |
| Majority | 374 | 33.9 | |||
| Turnout | 1,102 | ||||
| Conservative hold | Swing | ||||
References
[edit]- ^ "The District of Bassetlaw (Electoral Changes) Order 2000", legislation.gov.uk, The National Archives, SI 2000/3285, retrieved 20 August 2022
- ^ "Lib Dem vote slumps in home counties". guardian.co.uk. London. 19 September 2003. Retrieved 11 September 2009.
- ^ By-election results Archived 29 September 2010 at the Wayback Machine, Bassetlaw District Council
- ^ Harworth By-election results Archived 16 July 2011 at the Wayback Machine, Bassetlaw District Council
- ^ Worksop North East By-election result Archived 28 September 2011 at the Wayback Machine, Bassetlaw District Council
- ^ "Worksop South East By-Election 22nd March 2018 - Bassetlaw District Council". www.bassetlaw.gov.uk. Archived from the original on 24 March 2018. Retrieved 24 March 2018.
- ^ "Britain Elects on Twitter". Twitter. Retrieved 24 March 2018.
- ^ "Local Elections Archive Project — East Retford West Ward". www.andrewteale.me.uk. Retrieved 6 January 2024.
- ^ "Local Elections Archive Project — Ranskill Ward". www.andrewteale.me.uk. Retrieved 6 January 2024.
- ^ "Local Elections Archive Project — Sutton Ward". www.andrewteale.me.uk. Retrieved 6 January 2024.
- ^ "Local Elections Archive Project — Tuxford and Trent Ward". www.andrewteale.me.uk. Retrieved 6 January 2024.
- ^ "Local Elections Archive Project — East Retford South Ward". www.andrewteale.me.uk. Retrieved 6 January 2024.
- ^ "Local Elections Archive Project — Sutton Ward". www.andrewteale.me.uk. Retrieved 6 January 2024.
- ^ "Local Elections Archive Project — Rampton Ward". www.andrewteale.me.uk. Retrieved 18 November 2024.
- By-election results Archived 29 March 2010 at the Wayback Machine