2006 Stevenage Borough Council election
Appearance
(Redirected from 2006 Stevenage Council election)
| |||||||||||||||||||||||||||||||||||||
13 of the 39 seats to Stevenage Borough Council 20 seats needed for a majority | |||||||||||||||||||||||||||||||||||||
|---|---|---|---|---|---|---|---|---|---|---|---|---|---|---|---|---|---|---|---|---|---|---|---|---|---|---|---|---|---|---|---|---|---|---|---|---|---|
| |||||||||||||||||||||||||||||||||||||
 Map showing the results of contested wards in the 2006 Stevenage Borough Council elections. | |||||||||||||||||||||||||||||||||||||
| |||||||||||||||||||||||||||||||||||||
Elections to Stevenage Council were held on 4 May 2006. One third of the council was up for election; the seats which were last contested in 2002. The Labour Party stayed in overall control of the council.
After the election, the composition of the council was:
- Labour 32
- Liberal Democrat 4
- Conservative 3
Election result
[edit]| Party | Seats | Gains | Losses | Net gain/loss | Seats % | Votes % | Votes | +/− | |
|---|---|---|---|---|---|---|---|---|---|
| Labour | 11 | 0 | 0 | 0 | 84.6 | 46.4 | 10,466 | +6.6% | |
| Conservative | 1 | 0 | 0 | 0 | 7.7 | 29.7 | 6,711 | +0.3% | |
| Liberal Democrats | 1 | 0 | 0 | 0 | 7.7 | 21.8 | 4,913 | -6.5% | |
| English Democrat | 0 | 0 | 0 | 0 | 0 | 1.2 | 274 | +1.2% | |
| Green | 0 | 0 | 0 | 0 | 0 | 0.9 | 202 | -1.0% | |
Ward results
[edit]Bandley Hill
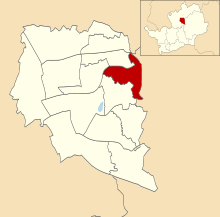
[edit]
| Party | Candidate | Votes | % | ±% | |
|---|---|---|---|---|---|
| Labour | John Lloyd | 824 | 50.9 | +5.9 | |
| Conservative | Freda Warner | 434 | 26.8 | −7.2 | |
| Liberal Democrats | Gordon Knight | 361 | 22.3 | +1.3 | |
| Majority | 390 | 24.1 | +13.1 | ||
| Turnout | 1,619 | ||||
| Labour hold | Swing | ||||
Bedwell
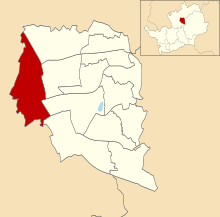
[edit]
| Party | Candidate | Votes | % | ±% | |
|---|---|---|---|---|---|
| Labour | Brian Underwood | 1,144 | 67.1 | +17.8 | |
| Conservative | Christine Saint-Leitner | 561 | 32.9 | +9.7 | |
| Majority | 583 | 34.2 | +8.1 | ||
| Turnout | 1,705 | ||||
| Labour hold | Swing | ||||
Chells
[edit]
| Party | Candidate | Votes | % | ±% | |
|---|---|---|---|---|---|
| Labour | Pamela Stuart | 860 | 45.5 | +10.1 | |
| Liberal Democrats | Audrey Griffith | 633 | 33.5 | −12.1 | |
| Conservative | Julie Seddon | 396 | 21.0 | +2.0 | |
| Majority | 227 | 12.0 | |||
| Turnout | 1,889 | ||||
| Labour hold | Swing | ||||
Longmeadow
[edit]
| Party | Candidate | Votes | % | ±% | |
|---|---|---|---|---|---|
| Labour | Suzanne Myson | 846 | 46.9 | +10.3 | |
| Conservative | Matthew Hurst | 618 | 34.3 | −1.6 | |
| Liberal Democrats | Ralph Baskerville | 340 | 18.8 | −8.7 | |
| Majority | 228 | 12.6 | +11.9 | ||
| Turnout | 1,804 | ||||
| Labour hold | Swing | ||||
Manor
[edit]
| Party | Candidate | Votes | % | ±% | |
|---|---|---|---|---|---|
| Liberal Democrats | Elisabeth Knight | 1,129 | 52.6 | −6.6 | |
| Conservative | Susan Smith | 545 | 25.4 | +3.4 | |
| Labour | Thomas McGarry | 472 | 22.0 | +3.2 | |
| Majority | 584 | 27.2 | −10.0 | ||
| Turnout | 2,146 | ||||
| Liberal Democrats hold | Swing | ||||
Martins Wood
[edit]
| Party | Candidate | Votes | % | ±% | |
|---|---|---|---|---|---|
| Labour | Jeannette Thomas | 698 | 43.4 | +7.9 | |
| Conservative | Richard Seddon | 553 | 34.4 | +2.5 | |
| Liberal Democrats | Barbara Segadelli | 357 | 22.2 | +2.2 | |
| Majority | 145 | 9.0 | +5.4 | ||
| Turnout | 1,608 | ||||
| Labour hold | Swing | ||||
Old Town
[edit]
| Party | Candidate | Votes | % | ±% | |
|---|---|---|---|---|---|
| Labour | Pamela Gallagher | 998 | 45.6 | +5.2 | |
| Conservative | James Fraser | 732 | 33.5 | −1.1 | |
| Liberal Democrats | Margaret Latham | 255 | 11.7 | −3.8 | |
| Green | Stuart Madgin | 202 | 9.2 | −0.4 | |
| Majority | 266 | 12.1 | +6.3 | ||
| Turnout | 2,187 | ||||
| Labour hold | Swing | ||||
Pin Green
[edit]
| Party | Candidate | Votes | % | ±% | |
|---|---|---|---|---|---|
| Labour | Tanis Kent | 933 | 52.4 | +5.9 | |
| Conservative | Mollie Cawthorn | 381 | 21.4 | −9.3 | |
| English Democrat | Richard Aitkins | 274 | 15.4 | +15.4 | |
| Liberal Democrats | Mary Griffith | 191 | 10.7 | −12.2 | |
| Majority | 552 | 31.0 | +15.2 | ||
| Turnout | 1,779 | ||||
| Labour hold | Swing | ||||
Roebuck
[edit]
| Party | Candidate | Votes | % | ±% | |
|---|---|---|---|---|---|
| Labour | Sherma Batson | 817 | 50.0 | +5.5 | |
| Conservative | Roger Gill | 471 | 28.8 | −0.8 | |
| Liberal Democrats | Denise Baskerville | 347 | 21.2 | −4.6 | |
| Majority | 346 | 21.2 | +6.3 | ||
| Turnout | 1,635 | ||||
| Labour hold | Swing | ||||
St Nicolas
[edit]
| Party | Candidate | Votes | % | ±% | |
|---|---|---|---|---|---|
| Labour | Caroline Latif | 772 | 50.7 | +9.5 | |
| Conservative | Matthew Wyatt | 398 | 26.1 | −3.5 | |
| Liberal Democrats | Heather Snell | 353 | 23.2 | −5.9 | |
| Majority | 374 | 24.6 | +13.0 | ||
| Turnout | 1,523 | ||||
| Labour hold | Swing | ||||
Shephall
[edit]
| Party | Candidate | Votes | % | ±% | |
|---|---|---|---|---|---|
| Labour | Robert Clark | 805 | 55.1 | +2.5 | |
| Liberal Democrats | Nicholas Baskerville | 378 | 25.9 | +3.2 | |
| Conservative | Leslie Clark | 277 | 19.0 | −5.6 | |
| Majority | 427 | 29.2 | +1.2 | ||
| Turnout | 1,460 | ||||
| Labour hold | Swing | ||||
Symonds Green
[edit]
| Party | Candidate | Votes | % | ±% | |
|---|---|---|---|---|---|
| Labour | Sharon Taylor | 909 | 53.9 | +7.3 | |
| Conservative | Claire Poole | 516 | 30.6 | −2.4 | |
| Liberal Democrats | Clive Hearmon | 261 | 15.5 | −4.8 | |
| Majority | 393 | 23.3 | +9.7 | ||
| Turnout | 1,686 | ||||
| Labour hold | Swing | ||||
Woodfield
[edit]
| Party | Candidate | Votes | % | ±% | |
|---|---|---|---|---|---|
| Conservative | Marion Mason | 829 | 54.4 | 0.0 | |
| Labour | Monika Cherney-Craw | 388 | 25.4 | +5.6 | |
| Liberal Democrats | Katherine Lloyd | 308 | 20.2 | −5.6 | |
| Majority | 441 | 29.0 | +0.4 | ||
| Turnout | 1,525 | ||||
| Conservative hold | Swing | ||||
