1931 United Kingdom general election
| |||||||||||||||||||||||||||||||||||||||||||||||||||||||||||||||||||||||||||||||||||||||||||||||||||||||||||||
All 615 seats in the House of Commons 308 seats needed for a majority | |||||||||||||||||||||||||||||||||||||||||||||||||||||||||||||||||||||||||||||||||||||||||||||||||||||||||||||
|---|---|---|---|---|---|---|---|---|---|---|---|---|---|---|---|---|---|---|---|---|---|---|---|---|---|---|---|---|---|---|---|---|---|---|---|---|---|---|---|---|---|---|---|---|---|---|---|---|---|---|---|---|---|---|---|---|---|---|---|---|---|---|---|---|---|---|---|---|---|---|---|---|---|---|---|---|---|---|---|---|---|---|---|---|---|---|---|---|---|---|---|---|---|---|---|---|---|---|---|---|---|---|---|---|---|---|---|---|---|
| Turnout | 76.4% ( | ||||||||||||||||||||||||||||||||||||||||||||||||||||||||||||||||||||||||||||||||||||||||||||||||||||||||||||
| |||||||||||||||||||||||||||||||||||||||||||||||||||||||||||||||||||||||||||||||||||||||||||||||||||||||||||||
 Colours[clarification needed] denote the winning party—as shown in § Results | |||||||||||||||||||||||||||||||||||||||||||||||||||||||||||||||||||||||||||||||||||||||||||||||||||||||||||||
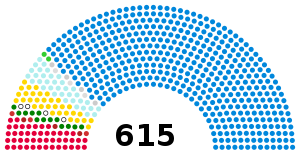
 Composition of the House of Commons after election | |||||||||||||||||||||||||||||||||||||||||||||||||||||||||||||||||||||||||||||||||||||||||||||||||||||||||||||
| |||||||||||||||||||||||||||||||||||||||||||||||||||||||||||||||||||||||||||||||||||||||||||||||||||||||||||||
The 1931 United Kingdom general election was held on Tuesday, 27 October 1931. It saw a landslide election victory for the National Government, a three-party coalition which had been formed two months previously after the collapse of the second Labour government.[1] Journalist Ivor Bulmer-Thomas described the result as "the most astonishing in the history of the British party system".[2]
Unable to secure support from his cabinet for his preferred policy responses to the economic and social crises brought about by the Great Depression, Prime Minister Ramsay MacDonald split from the Labour Party and formed a new national government in coalition with the Conservative Party and a number of Liberals. MacDonald subsequently campaigned for a "Doctor's Mandate" to do whatever was necessary to fix the economy, running as the leader of a new party called National Labour within the coalition. Disagreement over whether to join the new government also resulted in the Liberal Party splitting into three separate factions, including one led by former Prime Minister David Lloyd George.
Collectively, the parties forming the National Government won 67% of the popular vote and 554 (90.1%) of 615 seats in the House of Commons. Although the bulk of the National Government's support came from the Conservative Party, which won a majority in its own right with 470 seats, MacDonald remained Prime Minister. The Labour Party suffered its greatest ever defeat—losing four-fifths of its seats, including the seat of leader Arthur Henderson—and became the official opposition with just 52 MPs. The collapse of the Liberals into competing factions also ended their time as a significant force in British politics; the breakaway National Liberals were eventually absorbed into the Conservatives in 1947, while the main Liberal Party would spend the next half-century in the political wilderness until its revival in the 1970s.
It is the most recent election in which any single party (the Conservatives) received an absolute majority of the votes cast, and the last UK general election not to take place on a Thursday. It was also the last election until 1997 in which any single party won more than 400 seats.
Background
[edit]After battling with the Great Depression for two years, the Labour government of Ramsay MacDonald was faced with a budget crisis in August 1931. The cabinet deadlocked over its response, with several influential members—such as Arthur Henderson—unwilling to support budget cuts (in particular a cut in the rate of unemployment benefit) which were pressed by the civil service and opposition parties. Crucially, Chancellor of the Exchequer Philip Snowden refused to consider deficit spending or tariffs as alternative solutions, and without any other options to address the crisis the government was forced to resign. However, MacDonald was encouraged by King George V to form an all-party National Government in coalition with the Conservatives and Liberals in order to break the deadlock.
The initial hope was that the coalition government would hold office for only a few weeks in order to address the country's immediate economic crises, then dissolve for a return to ordinary party politics—but when the government was forced to remove the pound sterling from the gold standard it became clear that it would require more time in office. Meanwhile, the Labour Party expelled all those who were supporting the government, and MacDonald's decision to lead a Conservative-dominated coalition instead of the party he had co-founded was labelled a "betrayal" by his erstwhile colleagues and supporters. [3]
The Conservatives began pressing their partners to fight an election together as a combined unit in order to secure a mandate for radical economic reform, and MacDonald's supporters from the Labour Party formed the National Labour Organisation to support him. While initially against an early election, MacDonald came to endorse the idea in order to take advantage of Labour's unpopularity due to its poor economic record in office.
However, the Liberals were sceptical about an election and had to be persuaded. The key issue was the Conservatives' wish to introduce protectionist trade policies: the majority of the Liberals, led by Sir Herbert Samuel, were opposed, considering support for free trade to be a non-negotiable component of the Liberal political tradition. The argument split the party in half: Samuel withdrew the Liberals from the National Government (though continued to lend it their confidence, and still stood in the election as part of the coalition), while the National Liberals—under the leadership of Sir John Simon—remained, willing to support protectionism.
While this was happening, former prime minister David Lloyd George was still technically the Liberal Party's leader—however, due to having undergone an operation in early 1931, with a long recuperation, he was unable to take up a ministerial role when the National Government was formed. While initially supportive of both the coalition and its protectionist trade policy, he strongly opposed the proposal for an election. He and a third faction of Liberal MPs—the Independent Liberals—also broke away, and ran in the election on an anti-National Government platform.
Parliament was dissolved on 7 October.[4] In order to appease the various factions within the coalition its manifesto avoided proposing any specific policy, and instead asked voters for a "Doctor's Mandate" to do whatever was necessary to rescue the economy. Individual candidates were then allowed to state their support for policies such as trade tariffs.
Labour campaigned on opposition to public spending cuts, but this was a difficult position to justify when many of the cuts had initially been agreed when Labour was in government. By 1931, Labour had lost significant economic credibility due to soaring unemployment—especially in coal, textiles, shipbuilding and steel—and the party's working class base increasingly lost confidence in its ability to solve the most pressing problems facing the country.[5]
An additional problem for Labour came from the 2.5 million Irish Catholics in England and Scotland, who had traditionally been a major component of their working class base. By 1930 a number of Catholic bishops had grown increasingly alarmed at the party's stances on Communist Russia, birth control, and especially regarding funding Catholic schools, and the Church began to warn its members against voting Labour. This shift played a major role in Labour's collapse in support in some urban areas.[6]
Outcome
[edit]The election was a landslide for the National Government coalition, which won 67.2% of the popular vote and 518 seats out of 615 in the House of Commons—for both, it stands as the largest share ever secured in a British general election since the passage of the Reform Act 1832. (The next-best results were both was secured by the Whigs in 1832, who won 67.01% of the vote and 67.02% of seats under a substantially different electoral system with a much smaller electorate.) However, by far the largest share of the government's seats was won by the Conservatives, and the party's 470 seats also remains the record for the largest share of the total seats in Parliament (76.4%) won by any single party.
The victory gave the National Government a clear mandate to enact its policy platform, which the coalition believed would pull the economy out of the doldrums of the Great Depression. MacDonald remained Prime Minister, but the Conservatives were the dominant party within the coalition—National Labour contested only 20 seats, winning 13—and with his increasingly poor health over the course of the parliament he came to be more of a figurehead for the government rather than an active leader.
Labour's loss of vote share (a drop of 6.5%) was average by historical standards, but the inefficiency of its vote distribution under first-past-the-post meant that the party suffered a net loss of 235 out of 287 seats. This remains Labour's most significant absolute and per capita election loss, and it stood as the record for greatest number of seats lost by any party in a single general election until the Conservatives lost a net of 251 seats under Rishi Sunak in 2024.
Results
[edit]- Note: Seat changes are compared with the 1929 election result.

| Candidates | Votes | ||||||||||
|---|---|---|---|---|---|---|---|---|---|---|---|
| Party | Leader | Stood | Elected | Gained | Unseated | Net | % of total | % | No. | Net % | |
| National Government | |||||||||||
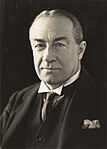
| Conservative | Stanley Baldwin | 518 | 470 | 210 | 0 | +210 | 76.4 | 55.0 | 11,377,022 | +16.9 | |
| Liberal | Herbert Samuel | 112 | 33 | 15 | 42 | −27 | 5.4 | 6.5 | 1,346,571 | −17.1 | |
| National Liberal | John Simon | 41 | 35 | 35 | 0 | +35 | 5.7 | 3.7 | 761,705 | N/A | |
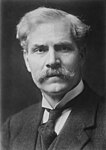
| National Labour | Ramsay MacDonald | 20 | 13 | 13 | 0 | +13 | 2.1 | 1.5 | 316,741 | N/A | |
| National | N/A | 4 | 4 | 4 | 0 | +4 | 0.7 | 0.5 | 100,193 | N/A | |
| National Government (total) | Ramsay MacDonald | 694 | 554 | +236 | 90.1 | 67.2 | 13,902,232 | +5.5 | |||
| Labour Opposition | |||||||||||
| Labour | Arthur Henderson | 490 | 46 | 2 | 243 | −241 | 7.5 | 29.4 | 6,081,826 | −7.7 | |
| Ind. Labour Party | Fenner Brockway | 19 | 3 | 3 | 0 | +3 | 0.5 | 1.2 | 239,280 | N/A | |
| Other unendorsed Labour | N/A | 6 | 3 | 3 | 1 | +2 | 0.5 | 0.3 | 64,549 | N/A | |
| NI Labour | Jack Beattie | 1 | 0 | 0 | 0 | 0 | 0.0 | 0.0 | 9,410 | N/A | |
| Labour (total) | Arthur Henderson | 516 | 52 | −235 | 8.5 | 30.6 | 6,395,065 | −6.5 | |||
| Other opposition parties | |||||||||||
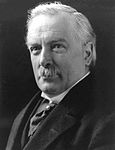
| Independent Liberals | David Lloyd George | 6 | 4 | 4 | 0 | +4 | 0.7 | 0.5 | 106,106 | N/A | |
| Nationalist | Joseph Devlin | 3 | 2 | 0 | 1 | −1 | 0.3 | 0.4 | 72,530 | +0.3 | |
| Communist | Harry Pollitt | 26 | 0 | 0 | 0 | 0 | 0 | 0.3 | 69,692 | +0.1 | |
| Independent | N/A | 7 | 3 | 0 | 3 | −3 | 0.5 | 0.2 | 44,257 | N/A | |
| New Party | Oswald Mosley | 24 | 0 | 0 | 0 | 0 | 0 | 0.2 | 36,377 | N/A | |
| National (Scotland) | Roland Muirhead | 5 | 0 | 0 | 0 | 0 | 0 | 0.1 | 20,954 | +0.1 | |
| Independent Labour | N/A | 3 | 0 | 0 | 1 | −1 | 0 | 0.1 | 18,200 | 0.0 | |
| Scottish Prohibition | Edwin Scrymgeour | 1 | 0 | 0 | 1 | −1 | 0 | 0.1 | 16,114 | 0.0 | |
| Liverpool Protestant | H. D. Longbottom | 1 | 0 | 0 | 0 | 0 | 0 | 0.0 | 7,834 | N/A | |
| Agricultural Party | J. F. Wright | 1 | 0 | 0 | 0 | 0 | 0 | 0.0 | 6,993 | N/A | |
| Ind. Nationalist | N/A | 1 | 0 | 0 | 0 | 0 | 0 | 0.0 | 3,134 | N/A | |
| Independent Liberal | N/A | 1 | 0 | 0 | 0 | 0 | 0 | 0.0 | 2,578 | −0.1 | |
| Plaid Cymru | Saunders Lewis | 2 | 0 | 0 | 0 | 0 | 0 | 0.0 | 2,050 | 0.0 | |
| Commonwealth Land | N/A | 2 | 0 | 0 | 0 | 0 | 0 | 0.0 | 1,347 | N/A | |
Votes summary
[edit]Seats summary
[edit]Transfers of seats
[edit]This differs from the above list in including seats where the incumbent was standing down and therefore there was no possibility of any one person being defeated. The aim is to provide a comparison with the previous election. In addition, it provides information about which party gained the seat.
- All comparisons are with the 1929 election.
- In some cases the change is due to the MP defecting to the gaining party. Such circumstances are marked with a *.
- In other circumstances the change is due to the seat having been won by the gaining party in a by-election in the intervening years, and then retained in 1931. Such circumstances are marked with a †.
- 1 Sitting MP had defected to the New Party
- 2 Sitting MP had defected to National Labour
- 3 Sitting MP had defected to Labour
- 4 Sitting MP had defected to Independent Labour
Results by constituency
[edit]These are available at the PoliticsResources website, a link to which is given below.
See also
[edit]- List of MPs elected in the 1931 United Kingdom general election
- List of MPs for constituencies in Wales (1931–1935)
- 1931 United Kingdom general election in Scotland
- 1931 United Kingdom general election in Northern Ireland
Footnotes
[edit]- ^ The seat and vote count figures for the Conservatives given here include the Speaker of the House of Commons
References
[edit]- ^ Macmahon, Arthur W. (1932). "The British General Election of 1931". American Political Science Review. 26 (2): 333–345. doi:10.2307/1947117. ISSN 0003-0554. JSTOR 1947117. S2CID 143537799.
- ^ Bulmer-Thomas, Ivor (1967), The Growth of the British Party System Volume II 1924–1964, p. 76
- ^ Martin Pugh Speak for Britain!: A New History of the Labour Party (2010) pp. 212–216
- ^ "Parliamentary Election Timetables" (PDF) (3rd ed.). House of Commons Library. 25 March 1997. Retrieved 3 July 2022.
- ^ Thorpe, Andrew (1996), "The Industrial Meaning of 'Gradualism': The Labour Party and Industry, 1918–1931", The Journal of British Studies, 35 (1): 84–113, doi:10.1086/386097, hdl:10036/19512, S2CID 155016569
- ^ Riddell, Neil (1997), "The Catholic Church and the Labour Party, 1918–1931", Twentieth Century British History, 8 (2): 165–193, doi:10.1093/tcbh/8.2.165
Further reading
[edit]- Ball, Stuart (1988), Baldwin and the Conservative Party: The Crisis of 1929–31, Yale University Press
- Bassett, R.Nineteen Thirty-One Political Crisis (1958)
- Close, D. H. (1982), "The realignment of the British electorate in 1931", History, 67 (221): 393–404, doi:10.1111/j.1468-229X.1982.tb01897.x
- Craig, F. W. S. (1989), British Electoral Facts: 1832–1987, Dartmouth: Gower, ISBN 0900178302
- Mowat, Charles L. "The Fall of the Labour Government in Great Britain, August, 1931," Huntington Library Quarterly 7#4 (1944), pp. 353-386 online
- Thorpe, Andrew (1991), The British General Election of 1931, Oxford, doi:10.1093/acprof:oso/9780198202189.001.0001, ISBN 9780198202189
- Thorpe, Andrew (1988), "Arthur Henderson and the British political crisis of 1931", Historical Journal, 31 (1): 117–139, doi:10.1017/S0018246X00012012, S2CID 154504816
- Toye, Richard (2003), "Plan or Perish: 1931 and its Impact", in Toye (ed.), The Labour Party and the Planned Economy, 1931–1951, vol. 32, Boydell and Brewer, pp. 34–64, ISBN 9780861932627, JSTOR 10.7722/j.ctt81jtf.7
External links
[edit]- 1931 election results by constituency
- United Kingdom election results—summary results 1885–1979 Archived 30 January 2012 at the Wayback Machine


